
Executive Summary
The outlook for the truckload market remains bleak after conditions weakened further in July as rates fell and fuel prices spiked. The oversaturation of capacity continues to impede any substantial impact from an uptick in demand. The disconnect between strong economic numbers and media headlines questioning the health of the economy still exists. Initial GDP estimates of 2.4% annualized growth in Q2 indicate a strong U.S. economy despite weaker goods consumption and international trade in goods. Import volumes were up 5% MoM in July and registered a 1.7% increase through the first seven months of the year compared to the same time in 2019. Overall, TEUs are in line with pre-pandemic averages, despite sitting 14% below 2022 levels when the industry was still working down the COVID-driven import boom. Yellow Corp., the nation’s third largest less-than-truckload carrier, filed bankruptcy at the end of July after 99 years of service, ceasing operations and leaving many customers scrambling to find alternative measures for transporting goods. While its operations had already begun deteriorating in the preceding months, the fallout is still likely to cause disruptions in the LTL industry and spill over into the truckload industry, though the impacts are likely to be minimal.
Main Takeaways
- Manufacturing activity in the U.S. contracted for the ninth consecutive month in July but at a slower pace than June.
- The contract-to-spot rate spread increased to $0.53 in July, as average linehaul rates decreased on the spot market side and increased in the contract market.
- Volumes shifted back to the contract market from the spot market following the Fourth of July holiday.
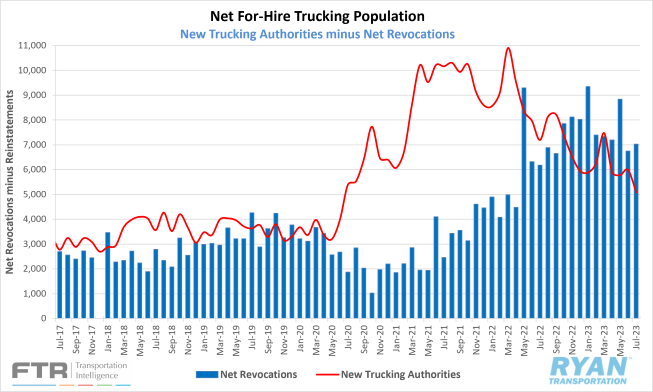
- The net trucking population decreased by 1,938 carriers as net revocations registered its second lowest figure since September 2022.
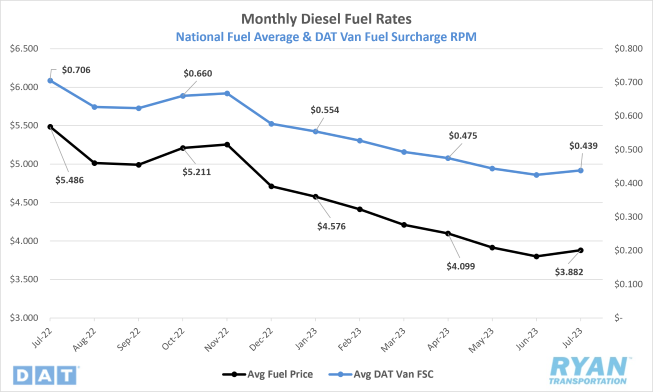
- The average price of fuel in July increased MoM for the first time in eight months following a $0.22 spike in the final week of the month.
Use the links below to jump to specific sections:
Economy | Spot Rates | Truckload Demand | Truckload Supply | Fuel Prices | Dry Van Overview | Reefer Overview | Flatbed Overview
Economy
United States ISM Manufacturing PMI
Key Points
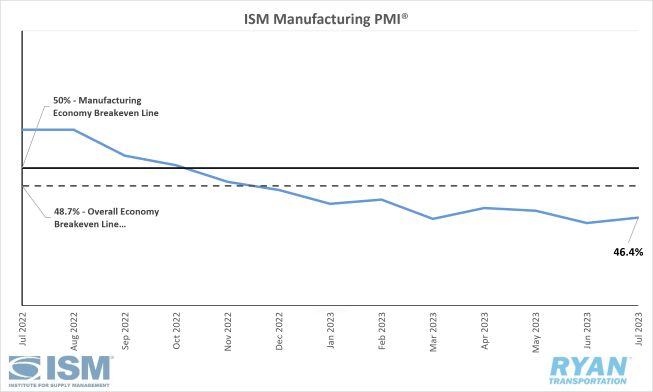
- The Institute of Supply Management (ISM®) Manufacturing PMI® registered 46.4% in July, 0.4 percentage points higher than June’s reading of 46.0%, and marks the ninth consecutive month of contraction in the manufacturing sector. Regarding the overall economy, July is the eighth consecutive month of contraction after a 30-month period of expansion.
- Of the five sub-indexes that directly factor into the Manufacturing PMI® (New Orders, Production, Employment, Supplier Deliveries, and Inventories), none registered in growth territory in July.
- The New Orders Index remained in contraction territory at 47.3%, 1.7 percentage points higher than June’s figure of 45.6%.
- The Production Index registered 48.3% in July, 1.6 percentage points higher than the June reading of 46.7% but still contracting.
- The Employment Index moved further into contraction territory, registering 44.4%, a 3.7 percentage point drop from the 48.1% figure recorded in June.
Summary
The manufacturing sector continued to shrink in July, but the increase in the PMI® indicates the rate of contraction is slowing. The July composite index continues to point towards businesses managing outputs to match persistent softness in demand levels. The demand component of the index eased further as New Orders contracted, however at a slower rate. The Customers’ Inventories Index remained in ‘too low’ territory, indicating tension levels exist between buyers and suppliers that could have a slight positive effect on future production. The Output/Consumption components, measured by the Production and Employment Indices, turned negative in July. Mixed sentiment on growth in the second half has companies continuing to reduce production and manage employee headcounts to a greater extent than in previous months, according to the ISM® report. Prices continue to decrease to levels not seen since May 2020 when the index registered 40.8%.
Why it Matters
The advance in the PMI® in July’s reading indicates that demand remains weak, but was slightly better compared to June’s reading. While the manufacturing sector contracted at a slower rate than it was in the previous month, July’s figure underperformed the consensus of 46.8%. Of the six largest manufacturing industries, the Petroleum & Coal Products industry was the only one to register growth in July. The outlook for the return of growth in manufacturing activity before the year’s end remains mild and is being reflected in the increased contraction of employment. According to the ISM®, there are signs that further reduction actions in employment in the near term will be a necessity to better match lower production output.
Macro Impacts
-
The Federal Reserve bumped rates by 25 basis points in the most recent meeting to 5.25%-5.50%, their highest level in 22 years.
-
The most recent Personal Consumption Expenditure Index (PCE) report released in July by the Bureau of Economic Analysis showed a 12-month increase of 3.0% of the overall PCE inflation rate, while core PCE, which excludes food and energy, showed an annual rise of 4.1%.
-
The Fed left the door open for future increases as it continues to try and navigate closer to its 2.0% inflation target rate. However, the consensus for trading the federal funds rate reflects a 79.1% probability of rates remaining unchanged at the next meeting, with a 20.3% probability of another 25 basis point increase, according to the CME Fedwatch Tool.
-
-
Total nonfarm payroll added 187,000 jobs, seasonally adjusted, in July as the unemployment rate saw little change to 3.5%, according to the recent Bureau of Labor Statistics (BLS) jobs report.
-
The BLS revised its initial June estimate down by 49,000, which adjusts the July figure down closer to 185,000.
-
Total Transportation and Warehousing payroll employment dropped by 8,400 in July, led by Warehousing and Storage (-5,600), Couriers and Messengers (-3,400) and Truck Transportation (-2,900).
The labor participation rate remained at 62.6% for the fifth consecutive month.
-
-
Similar to June, headline and core inflation both rose 0.2% in July on a seasonally adjusted basis according to the Consumer Price Index (CPI) report released by the BLS.
-
The All-Items index increased 3.2% over the last 12 months while All-Items less food and energy rose 4.7%, both seasonally adjusted.
-
Shelter remains the largest contributor to the monthly All-Items increase, accounting for over 90% of the increase according to the report.
-
The energy index has decreased 12.5% over the last 12 months while the food index has increased 4.9% during the same time.
-
Industry Overview
July Key Figures (YoY)
| Truck Data Points | YoY Change (%) |
|---|---|
| DAT Spot Rates (incl. FSC) | -21.3 |
| Fuel Prices | -29.2 |
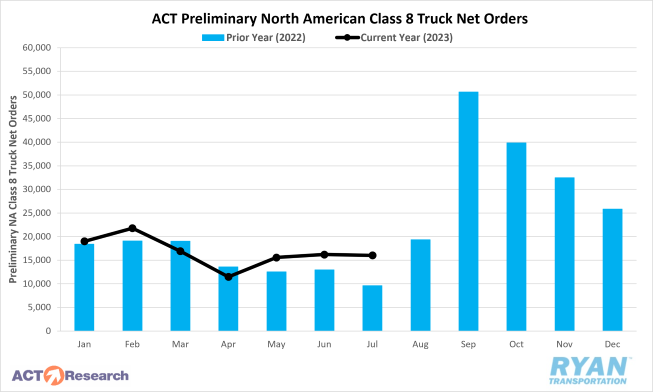
| ACT Class 8 Preliminary Orders | 45.0 |
| ATA NSA Truck Tonnage | -0.9 |
| Cass Freight Index | -12.7 |
| Cass Freight Expenditures | -24.4 |
| Cass Freight Shipments | -8.9 |
Spot Rates
Key Points
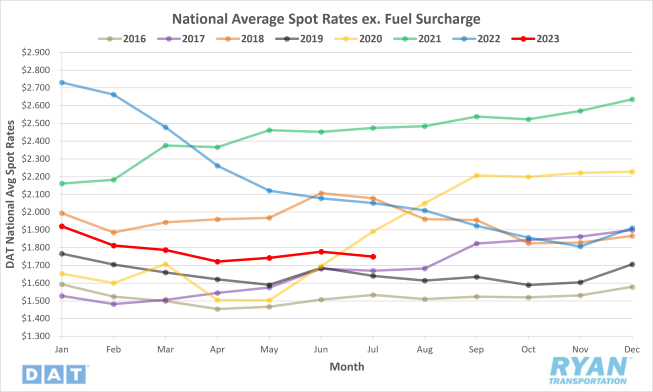
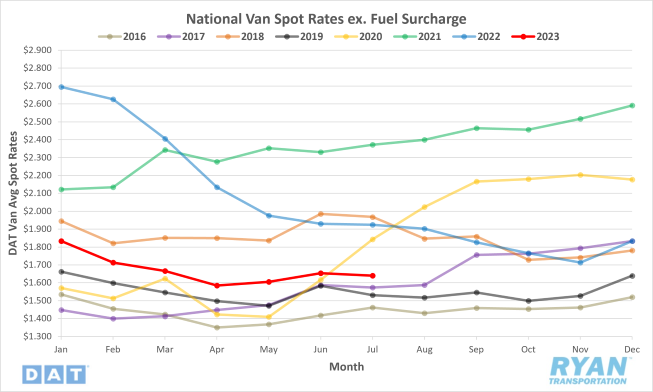
- National average spot rates excl. fuel decreased in July after two consecutive months of increases, falling 1.6% from June and sitting 14.7% below the same time last year.
- The national average linehaul rate has now spent 10 consecutive months below the 5-year average, with rates in July registering 11.1% lower.
Contract Rates
Key Points
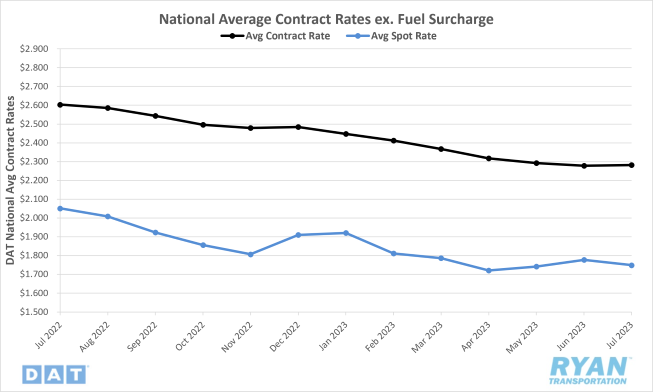
- After six months of sequential declines, the national average contract rate excl. fuel increased 0.2% MoM in July but still remains 12.4% below 2022 levels.
- The increase in national contract rates and decrease in spot rates pushed the contract-to-spot spread back up by 6.4%, or $0.03, in July.
Summary
Following the two consecutive months of increases and spikes leading up to the Fourth of July holiday, the 7-day average for national linehaul rates declined consecutively WoW in July, ending the month just over 5.0%, or $0.09, lower than where it started. In the final week of the month, the national average spot rate excl. fuel recorded its second lowest reading of the year, barely missing matching the lowest figure by fractions of a cent. Average linehaul rates closed out July just under 17.6%, or $0.39, below rates at the start of the year and sit $0.34 below the final week of July 2022. On the contract side, rates reversed their negative trend, though marginally, after six consecutive months of declines. Prior to the increase in July, the national average contract rate had recorded declines in 10 of its last 11 readings. The inverse move between spot and contract rates moved the already elevated contract-to-spot spread further away from the pre-pandemic average to $0.533.
Why it Matters
The decline in spot rates was not unprecedented and fell in line with typical expectations for this time of year. Following the spikes caused by monthly and quarterly books closing ahead of a major holiday disruption, there is generally some downtime in freight activity as shippers and customers switch gears in preparation for the back-to-school push. The MoM increase in contract rates is likely a combination of implementing new contract rates from bids that occurred in Q4 of last year and Q1 of this year, and the slowing of lane discounts as we move along the bottom of the market. The uptick in rates in Q2, following the lows experienced in May, caused speculation that an inflection point had been reached and the market was returning to equilibrium, bringing prices up with it. This exposed companies that had moved to quarterly pricing or mini bids initially to take advantage of savings from the deteriorating market. Typical seasonality would suggest rates can only go up from here based on future elevated demand events and holiday disruptions. However, any further discounts to spot market rates, paired with the rise in fuel costs, will likely be catastrophic to smaller carriers in the market.
Truckload Demand
Key Points
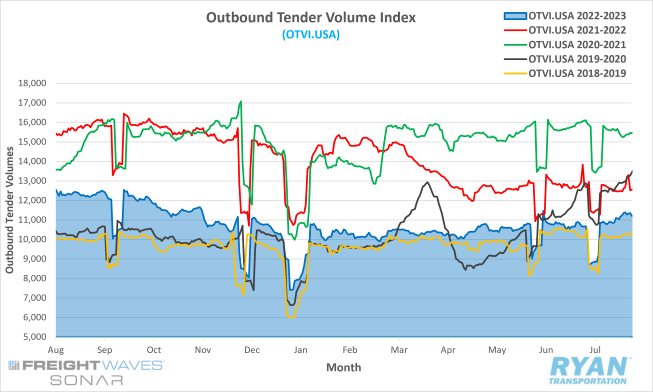
- The FreightWaves SONAR Outbound Tender Volume Index (OTVI), which measures tender volumes across all modes, ended the month up 5.2% over the level at the end of June
- July’s monthly average of daily tender volumes, recorded by the OTVI, dropped 1.2% from June’s average of 10,640.4 to 10,509.7.
- Similar to June, the tender volume index registered 15.2% lower than the same time last year and sits 12.1% below the 5-year average.
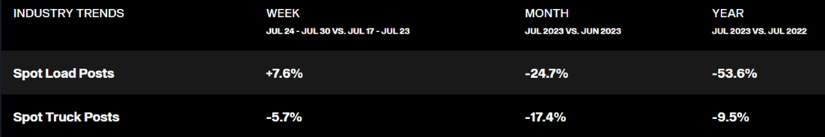
- Spot market activity increased in the final week of July but overall volumes continued to deteriorate, falling 24.7% from June and 53.6% below July 2022
- The Cass Freight Index, which analyzes the number of freight shipments in North America and the total dollar value spent on those shipments, continued to record YoY declines in July, with both shipments and expenditures dropping 8.9% and 24.4%, respectively.
Summary
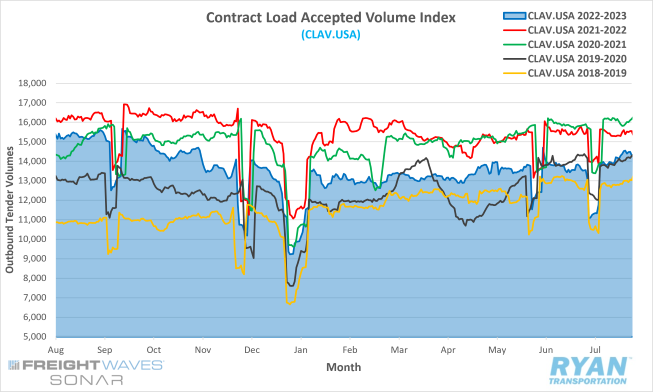
Tender volumes opened the month flat, with the elevated levels seen in the last week of June before plummeting just over 18% immediately following the Fourth of July holiday. Like most major holidays that impact the workforce for both shippers and carriers, volumes remained depressed through the first full week of July, averaging 15.3% below where they started the month. In previous years, freight tenders typically rebound in the second week of the month back to (or just under) the levels seen in the days leading up to the holiday. In July 2023, volumes started the week roughly 5.3% above the pre-holiday spike, putting them in line with 2018 readings during the same week and 8.4% above 2019 recordings. Overall activity continues to favor moving within the contract market, as indicated below by the FreightWaves SONAR Contract Load Accepted Volumes (CLAV), which measures accepted load volumes moving under contracted agreements minus the rejected tenders. Contract volumes ended the month 5.8% above where they started the month but remain 8.0% below the end of July last year.
Why it Matters
The increase in tender volumes throughout July went against normal seasonality for this time of the year. The typical summer pattern consists of volumes increasing moderately from mid-May through the end of June, before dropping off in July following Independence Day. Volumes generally rebound again in August ahead of back-to-school shipping and peak maritime shipping season. Several theories have been floated for the unseasonal uptick in volumes in July. One theory stemmed from the recent labor disputes experienced in the LTL industry for Yellow and UPS, causing companies to shift volumes to the TL side in anticipation of disruptions should either provider cease operations. Another theory suggests back-to-school and peak shipping season for ocean carriers came early this year. Kuehne+Nagel, the world’s largest logistics provider, recently forecasted in their quarterly earnings call that peak shipping season for ocean carriers would once again be muted to nonexistent, similar to 2022. Differences aside, both theories are not sustainable over the long-term for influencing future demand levels, but would instead only cause a short-term impact to the truckload industry. The elevated demand levels in July are likely not from one singular reason but rather a combination of factors. Significant changes in future volumes will require deeper economic ties, making the long-term outlook relatively unpredictable.
Truckload Supply
Key Points
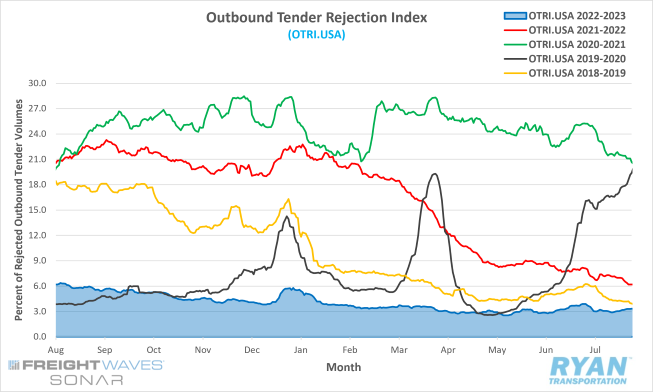
- The FreightWaves SONAR Outbound Tender Rejection Index (OTRI), which measures the number of contracted loads rejected by carriers reflected as a percentage, dropped 56 basis points (bps) to end the month at 3.3%.
- The monthly average of daily rejection rates for July registered 3.2%, which put it 3.9% below 2022 levels and 11.4% under the 5-year average.
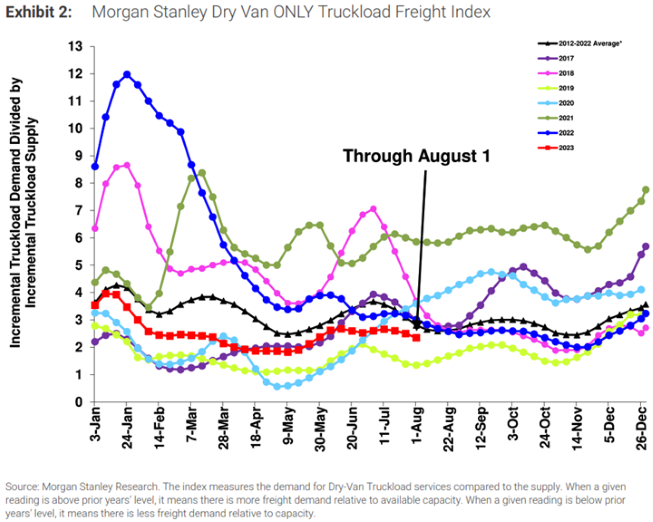
- The Morgan Stanley Truckload Freight Index (MSTLFI), which measures the demand for dry van truckload services compared to the supply, outperformed seasonality in July due to the strong performance of the demand component. Despite decreasing sequentially in July, the index is slowly returning closer to its long-term averages.
Summary
Tender rejections started the month off strong, with the OTRI recording its highest level since January 16 in the first two days of the month. Rejection rates resumed their negative trend following the Fourth of July holiday, dropping an alarming 100 bps by the start of the third week and approaching the low levels seen in May. While the OTRI recovered from the mid-month slump to close out July just half a point below where it started, tender rejections continue to hover around all-time lows for the summer. Compared to previous years, rejection rates at the end of July were 285 bps below the same time in 2022 and 62 bps below 2019 levels.
Why it Matters
Truckload supply remains in abundance despite the demand environment showing no real signs of improvement. In a normal market, a 5% increase in overall demand would strain capacity and put upward pressure on both tender rejections and truckload prices. Due to the over-saturated conditions with current market capacity, carriers easily absorbed the additional volume without sacrificing service levels or inflating linehauls. The data from July continues to indicate that a surge in demand from its current levels is not enough to cause a significant shift in rejections or prices. For the market to reach an inflection point and begin to return towards equilibrium, a considerable decline in the truckload supply is required.
Truckload Capacity Outlook
Key Points
- Total net revocations, which is total operating authority revocations minus reinstatements, increased 4.1% MoM in July to 7,030, according to FTRs preliminary analysis of the Federal Moter Carrier Safety Administration’s (FMCSA) data.
- According to FTR, the FMCSA authorized 5,092 new for-hire trucking companies in July, a 15.0% decline from June’s figure of 5,994.
- Preliminary North American Class 8 Orders exceeded expectations in July, registering between 13,500 to 16,000 units and up 25% to 45% YoY depending on the estimate.
Summary
Net revocations continued to exceed new entrants in July, as the net change in the carrier population decreased by 1,938 carriers. July’s figure more than doubled the net decrease of 757 carriers recorded in June. While the uptick in net revocations over new entrants was expected given the current market conditions, the net revocation figure of 7,030 in July, aside from June, was at the lowest since September. According to FTR’s analysis, the net change in the carrier population has decreased in nine of the last 10 months, as new entries appear to be gradually returning to the pre-pandemic norm. Although net revocations remain elevated compared to pre-pandemic years, payroll employment in the trucking sector has only declined by 0.4%, or 7,100, jobs since the start of the year. The data suggests that, up until recently, larger fleets have absorbed drivers from smaller fleets that failed or owner operators that could no longer afford to operate independently. Active utilization remains around 88%, 4% lower the 10-year average of 92%, and is likely to remain at that level into 2024, according to FTR. Class 8 orders came in above expectations for July but remain below replacement demand as OEMs continue to work through backlogs. Overall order levels remain weak, which is typical for this time of the year as customers wait for OEMs to open their 2024 order slots.
Why it Matters
The record high revocations so far this year have been expected given the soft demand environment and weak outlook. Speculation for the elevated new entry numbers each month suggests California’s AB5 law could be partially responsible. The law bans the leased owner-operator model within the state, thus encouraging firms to operate under their own authority. The percentage of new carriers based out of California jumped 14.7% in July, reaching its highest level since February 2020 per FTR. As is the case across the rest of the country, for-hire trucking companies have likely reached their threshold for taking anymore drivers or owner-operators. As volumes continue to suffer, spot rates remain stable at best and fuel prices surge, expect the number of new entrants to decrease and the number of carrier failures to increase until balance is restored.
Fuel Prices
Key Points
- The national average price of diesel increased MoM for the first time since November, ticking up 2.1%, or $0.08, in July to $3.882.
- Average fuel prices remain well below the record setting levels of 2022, with July’s average down 29.2% YoY.
- Fuel prices spiked 5.7%, or $0.22, in the final week of July, marking the largest WoW increase and most significant WoW change since October 10 of last year.
Summary
After dropping $0.034 in the final week of June, the national average price of diesel rallied in July to end the month $0.360 above where it had started. With little to no change in the first half of the month, fuel prices surged in the back half with the final two weeks accounting for nearly 90% of the monthly gains experienced in July. The last week alone saw the second largest WoW net change in fuel prices, whether negative or positive, in the last 12 months, with the only other time occurring in the first full week of October. July marked the first time since February 2022 where the national average fuel price did not post a WoW decline in a full week of the month. Draws on commercial crude inventories outpaced expectations for July, likely because of the largest U.S. weekly draw in history during the week ending July 28, according to data provided by the EIA. After initially announcing production cuts would last through August, Saudi Arabia recently announced it would extend its output reduction through September, putting further pressure on global supply.
Why it Matters
Oil producers saw a much-needed rebound in demand levels in July, but there remain doubts on if increasing fuel prices are here to stay. From a bullish perspective, the additional production cuts by Saudi Arabia are starting to have the desired effect of raising prices. This means the continued extension of decreased supply will likely be felt later in the year as holiday travel ramps up. The total active drilling rig count in the U.S. continues to decline as well, reaching its lowest level since March 2022 according to the most recent Baker Huges survey. The current administration was effectively able to temper the inflated prices following the Russian invasion of Ukraine through the release of 180M bbls from the Strategy Petroleum Reserve (SPR) into the commercial market to increase global supply. However, the SPR currently sits at a 40-year low and any further releases would require full bipartisan support, a feat the White House is unlikely to achieve ahead of elections.
From a bearish perspective, the increases could be an isolated incident as July, on average, is the hottest month of the year in the United States and, coincidentally, is also the heaviest travel month of the year from a historical standpoint. In a recent report by the American Automobile Association (AAA), travel over the Fourth of July weekend was projected to set a new record for the holiday. As travel was expected to increase, so were the temperatures. The recent change in climate patterns from La Niña to El Niño this year ushered in hotter and dryer weather patterns across the country, requiring increased use of air conditioning and burning more fuel. Other factors that could return oil prices to their negative declines in the future include further rate hikes by the Federal Reserve, and the return of Student Debt payments in September putting a strain on consumers’ wallets.
Dry Van Overview
Spot Rates
Key Points
- The national average dry van spot rate excl. fuel declined by just over 0.9%, or $0.014, MoM in July to $1.639.
- Linehaul spot rates for dry vans in July were down 14.8% YoY and sit 12.3% below the 5-year average.
- The national average contract rate excl. fuel for dry vans dropped by 0.6%, or $0.013, MoM in July to $2.131 and registered 14.2% below the same time last year.
Load-to-Truck Ratio
Key Points
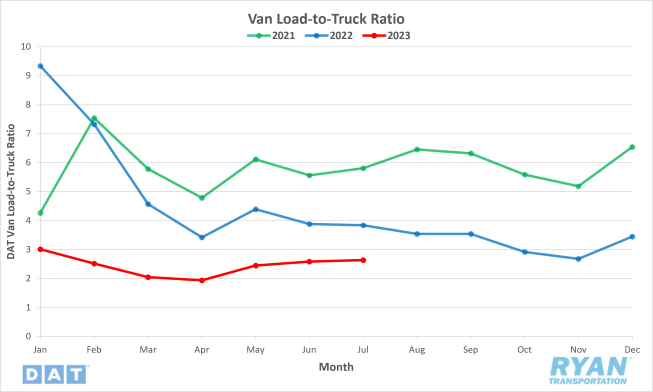
- The dry van load-to-truck ratio (LTR) increased 1.9% MoM in July but was 31.3% below 2022 levels
Market Conditions
Dry Van Summary
The dry van sector outperformed the other modes in July in terms of volume and rate activity. According to FreightWaves' analysis of several SONAR indices, long-haul dry van volumes surged in July and were the primary driver for the increase in overall volumes, with much of the demand stemming from the Southern California markets. Freight activity in the van sector generally gets a boost from back-to-school shipping, which ramps up mid- to late-July and is heavily skewed towards dry van carriers. However, the increase in retail volumes is generally offset by a shift of certain perishable and non-perishable goods volumes to the reefer market, in order to avoid damage or spoilage from the excessive heat waves that typically occur around the same time. The rise in volumes, though, was not enough to continue the positive rate trend seen in May and June. The 7-day average for dry van linehaul rates ended the month down 5.2%, or $0.09, from the start of July and 19.3%, or $0.39, below the start of the year.
Reefer Overview
Spot Rates
Key Points
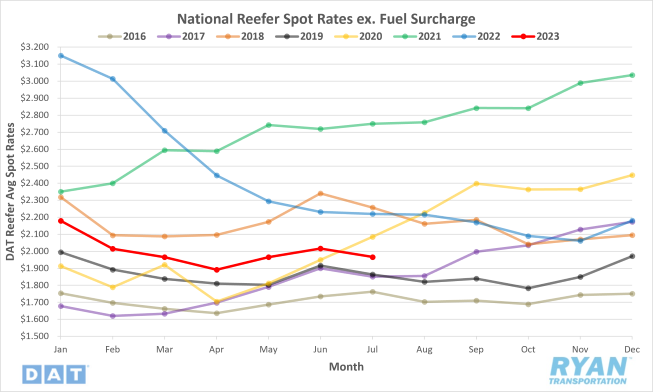
- The national average reefer spot rate excl. fuel decreased 2.5%, or $0.05, MoM in July to $1.966.
- Average linehaul spot rates for reefers were down 11.4% YoY and 9.4% below the 5-year average.
- Contract reefer spot rates excl. fuel remained virtually unchanged in July, increasing 0.2% to $2.431, but sits 10.6% below July 2022 levels.
Load-to-Truck Ratio
Key Points
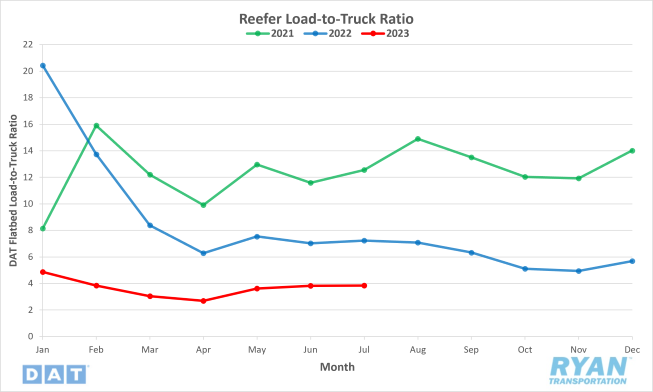
- The Reefer LTR increased 0.5% MoM in July but remains 46.8% below 2022 levels
Market Conditions
Reefer Summary
The bulk of domestic produce shipping has started to taper off as volumes begin to shift north and peak season nears its end. Spot market activity in the reefer sector increased in July but at a much slower pace than in the previous two months. Reefer demand is generally at its highest during the summer months, with rates and volumes peaking in the week leading up to the Fourth of July. The 7-day average for reefer linehaul rates saw a $0.04 jump during that week this year, registering the second highest WoW increase YTD and recording its highest level since the second week of February. Following the holiday, the 7-day average linehaul rate declined consecutively WoW throughout July to end the month down $0.10 from where it started. Based on general seasonality, volumes and rates are likely to remain flat or continue their negative trend for the coming months until November, when shipping demand for fresh turkeys begins to ramp up for Thanksgiving.
Flatbed Overview
Spot Rates
Key Points
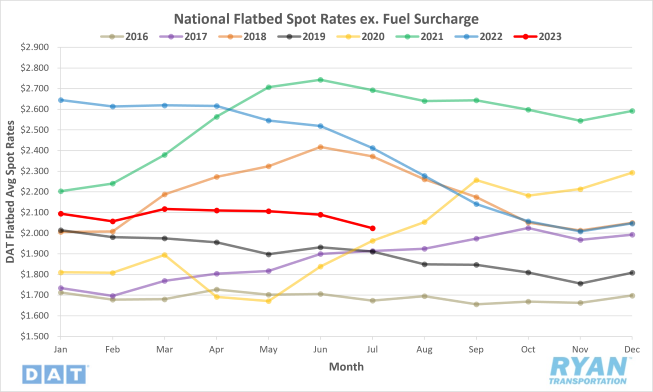
- The national average flatbed spot rate excl. fuel declined 3.2%, or $0.066, MoM to $2.024 in July.
- Flatbed linehaul spot rates registered 16.1% below the same time last year and 8.5% below the 5-year average.
- Average contract rates excl. fuel for flatbeds increased 2.4%, or $0.064, to $2.734 but remains 7.7% below 2022 levels.
Load-to-Truck Ratio
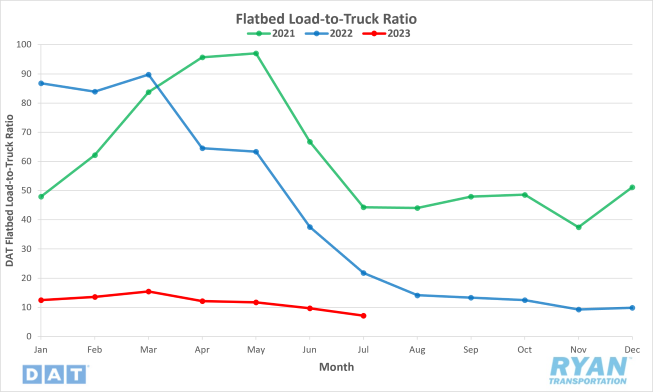
Key Points
- The Flatbed LTR declined significantly MoM in July by 26.2% and is down 67.2% YoY.
Market Conditions
Flatbed Summary
Unlike the van and reefer sectors that saw volume growth in July, the flatbed market continues to underperform typical seasonality due to the nonexistence of its normal peak season. Spot volumes continue to trend negatively for flatbed carriers in 2023, falling 26.3% MoM from June and sitting 67.3% below the same time last year. Despite performing the worst of the three modes in terms of freight activity, spot rates in the flatbed sector have been much less volatile compared to its counterparts. The 7-day average for flatbed linehaul rates recorded sequential declines through July, dropping $0.09 by the end of the month from where they started and sitting $0.22 below levels at the start of the year. The continued decline in oil prices, causing more drilling rigs to be taken offline, has had the largest negative impact on flatbed rates. Following a surge in residential construction in May, the number of new homes started in June fell 7% MoM and was down 8% on an annual basis. As growth in the housing market has stalled, government spending on the infrastructure bill is likely going to have to drive volumes in the coming months, as bridge and tunnel investment is starting to trend significantly higher.
Intermodal
Spot Rates
Key Points
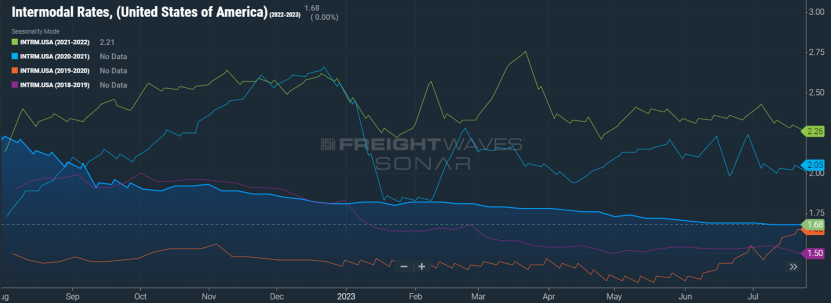
- The FreightWaves SONAR Intermodal Rates Index (INTRM.USA), which measures the average weekly all-in door-to-door intermodal spot rate for 53’ dry vans across a majority of origin-destination pairings, remained flat in July at $1.69 and sits 25.9% below last year’s levels.
- Compared to the 5-year average, the INTRM.USA sits 8.1%, or $0.15, below.
Volumes
Key Points
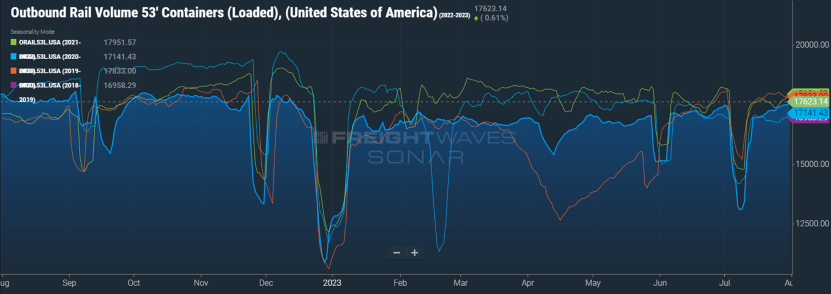
- Total loaded volumes for 53’ containers from all domestic markets, measured by the FreightWaves SONAR Loaded Outbound Rail Volume Index (ORAIL53L.USA), ended the month 0.9% above where they started the month.
Intermodal Summary
The drop in volumes at the start of the month was in line with typical seasonality patterns for the intermodal carriers because of the lost workday. Following the holiday, carload volumes were able to rebound in July to end the month above where they started due to the growth in economically sensitive freight commodities. Heading into the third and fourth quarter, however, there is not expected to be a peak season for intermodal carriers this year due to economic concerns and lower import volumes. Competition with the truckload industry continues to pose a threat on sustainable growth for the intermodal industry, as active truck utilization remains below historic averages. The FreightWaves SONAR Intermodal Contract Savings Index (IMCSI1.USA), which measures the average percent difference between all-in intermodal contract rates and all-in truckload rates in the same lane, finished the month at 8.28%, a 0.1% decrease from where it started.
Further Reading
- Maritime operators, ports, take a step back as slack demand, destocking depress volumes and rates – DC Velocity
- Kuehne+Nagel writes off peak shipping season – FreightWaves: American Shipper
- US Class 8 Retail Sales in July Present Mixed Picture – Transport Topics
- Yellow’s demise: 2 decades in the making – FreightWaves