
Executive Summary
It is becoming increasingly difficult to ignore the similarities between the current market and the recession market of 2019 through the first six months of the year. An oversupply of capacity without a foreseeable rebound in demand, at least in the near term, remains the headline each month. Declining fuel prices and rate spikes from seasonal disruptions continue extending the operating window for many carriers, despite overall rates falling below breakeven costs. Imports in June registered 6% above June 2019 levels pushing total imports through the first half of the year, up just 2% over total imports in the first six months of 2019. It is too early to say whether the current market has truly reached its floor yet, but there are two sides to every argument.
From an optimistic point of view, inventory levels are beginning to rebalance as destocking and consumer spending appear to be trending in a positive direction. The more pessimistic outlook shows that consumer spending continues to be focused primarily in the services sector, and the period for new orders to make it downstream in the supply chain does not translate to immediate volume. The increase in rates experienced in May and June were characteristic of typical seasonal disruptions and could be misconstrued as a false inflection point. As peak produce shipping season has already shown, a moderate increase in demand is only enough to slow the rate of price declines. Without a strong correction in truckload supply, further price erosion will continue.
Main Takeaways
- Inventory levels fell in June but manufacturing activity in the U.S. contracted at a faster pace than the previous month.
- The national average spot rate excl. fuel increased for the second consecutive month while simultaneously decreasing on the contract side, dropping the contract-spot rate spread to $0.52.
- Spot market volumes spiked in the final week of the month but were down overall in June, as the contract market remains more favorable.
- The net trucking population declined by 757 carriers, which is significantly less than the 3,058-carrier decline recorded the month prior.
- A year after reaching record highs, the national average price of diesel has dropped over $1.95/gallon over the last 12 months.
Use the links below to jump to specific sections:
Economy | Spot Rates | Truckload Demand | Truckload Supply | Fuel Prices | Dry Van Overview | Reefer Overview | Flatbed Overview
Economy
United States ISM Manufacturing PMI
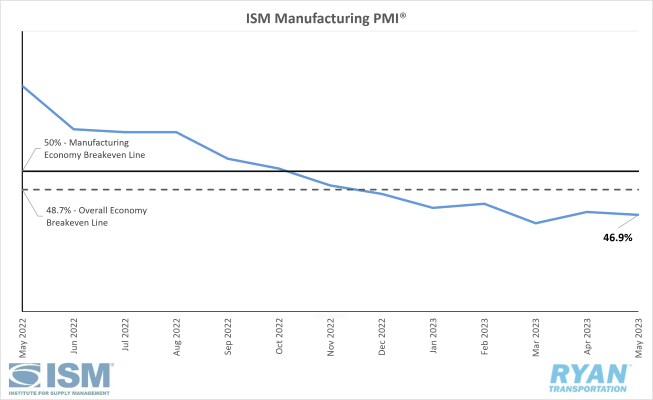
- The Institute for Supply Management (ISM®) Manufacturing PMI® contracted in June, registering 46.0%. This is a 0.9% decline from May’s reading of 46.9% and marks the eighth consecutive month of contraction in the manufacturing sector. June is the seventh consecutive month of contraction regarding the overall economy, after a 30-month period of expansion.
- The New Orders Index remained in contraction at 45.6%, a 3.0% increase from May’s reading of 42.6%.
- The Production Index recorded a 4.4% decrease from May’s figure of 51.1% to 46.7% and moved back into contraction after spending one month in expansion.
- The Employment Index returned to contraction, registering 48.1%. This marks a 3.3% decline from the 51.4% reading in May.
- The Backlog of Orders index remains well into contraction after a 1.2% increase from May’s reading of 37.5% to 38.7%.
The manufacturing sector in the U.S. shrank further, with June’s reading indicating that contraction is occurring at a faster rate. The index continues to reflect slowing output to match the soft demand environment, as the prospect for growth in the second half of the year diminishes. The demand component of the index eased further, as new orders saw moderate improvement from the previous month. However, it remained well below the breakeven line, with the backlog of orders staying at levels not seen since early in the pandemic. A positive note for demand came in June as customer inventory levels dropped into “too low” territory, providing optimism for future production. Outputs and consumption, measured by the Production and Employment Indices, combined for 7.7 percentage points of negative pressure on the Manufacturing PMI®, according to the ISM®. Companies will begin managing head counts from reduced production and the outlook is mixed on whether significant growth will return this year. The input components continue to harbor future demand growth, as supplier deliveries indicated faster deliveries and prices fell further into “decreasing” territory per the ISM®.
The consensus for the June PMI® reading ahead of the release of the ISM® report was 47.0%, indicating continued contraction in the manufacturing sector but with positive indicators supporting the view of production growth in the back half of the year. The underperformance of the index shifted the once heavily optimistic outlook to a more pessimistic anticipation of further declines in demand. Of the six largest manufacturing industries, only transportation equipment registered growth in June. As production expectations for the remainder of the year turn negative, companies that retained head count to hedge an increase in new orders are being forced to revise previous forecasts and reduce employment numbers to match weak demand projections. Some hope for growth remains, however, as destocking has moved customer inventories into “too low” territory and prices continue to decline, creating an opportunity for upward pressure on new orders and production in the future.
Macro Impacts
- Nonfarm payroll employment increased by 209,000 jobs in June, according to the most recent Bureau of Labor Statistics (BLS) jobs report.
- The unemployment rate varied a little to 3.6%, a 0.1% decrease from May’s reading of 3.7%.
- Total transportation and warehousing employment also saw slight change, decreasing by 6,900 jobs, driven by warehousing and storage as truck transportation remained flat from May.
- According to the CME FedWatch Tool at the time of this writing, the Federal Reserve is expected to resume increasing the federal funds rate at the next meeting toward the end of the month.
- The consensus probability of another 25-basis point rate hike to 5.25%-5.50% sits at 94.9%, versus the 5.1% consensus that the rate will remain unchanged at 5.00%-5.25%.
- The Personal Consumption Expenditures Index (PCE) released by the Bureau of Economic Analysis, the Feds preferred measure of inflation, showed an increase of 3.8% YoY in June. This suggests further tightening of monetary policy might not be a necessity, especially when compared to the 5.4% growth recorded in January.
- Both headline and core Consumer Price Index (CPI) rose in June by 0.2% MoM after rising 0.1% in May on a seasonally adjusted basis, per the most recent BLS CPI Report.
- The All Items Index increased 3.0% over the last 12 months, marking the smallest annual increase since March 2021.
- All items less food and energy increased 4.8% on an annual basis while energy has decreased 16.7% and food has increased 5.7% over the last 12 months.
- Shelter remains the largest contributor to the monthly increases, accounting for over 70% of the increase, with motor vehicle insurance coming in second.
Industry Overview
June Key Figures (YoY)
| Truck Data Points | YoY Change (%) |
|---|---|
| DAT Spot Rates (incl. FSC) | -22.4 |
| Fuel Prices | -33.9 |
| ACT Class 8 Preliminary Orders | 5.0 |
| ATA NSA Truck Tonnage | 0.4 |
| Cass Freight Index | -14.1 |
| Cass Freight Expenditures | -24.5 |
| Cass Freight Shipments | -4.7 |
Spot Rates
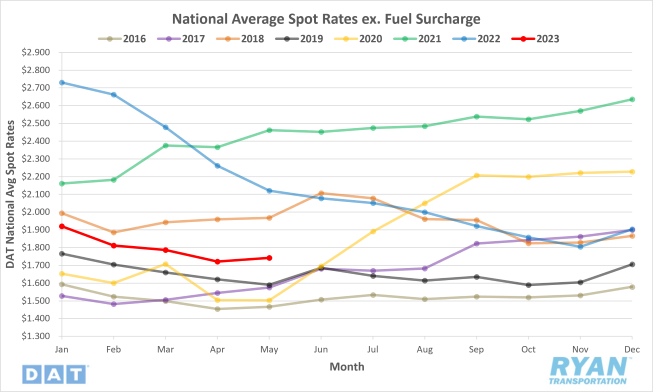
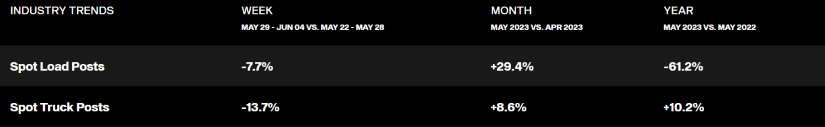
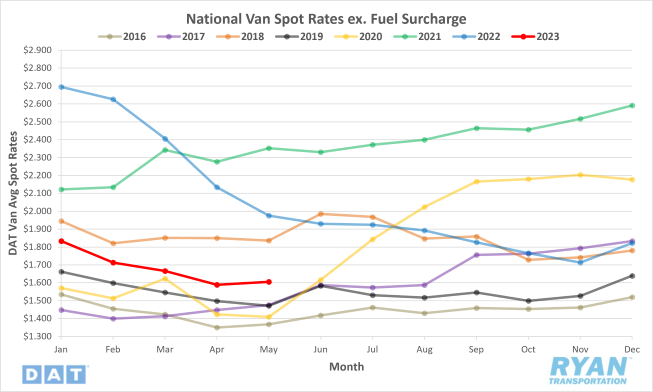
- National average spot rates excl. fuel increased for the second straight month in June, increasing 2.0% MoM but sitting 14.5% below the June 2022 average.
- For the ninth consecutive month, linehaul spot rates were below the 5-year average with June’s average registering 8.9% lower.
Contract Rates
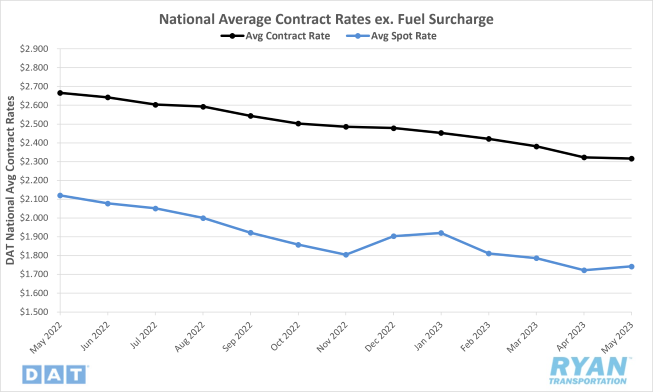
- National average contract rates excl. fuel declined by 0.9% MoM in June and is down 13.1% on an annual basis.
- The contract-to-spot spread fell by 9.5%, or $0.054, to $0.52, the largest MoM decline in the spread since December 2022.
The national average spot rate excl. fuel remained relatively flat, with a slight decrease through the first three weeks of June before jumping 1.9% in the final week to bring the monthly average just over the average in May. The rate spikes in the final week were driven by a 2%, or $0.04, jump in both dry van and refrigerated segments due to peak demand for domestic and imported produce shipping. On the contract side, June marked the 16th consecutive month of sequential MoM declines as negative pressure from the spot market continues to pull rates down. The contract-to-spot rate spread narrowed further in June for the third straight month, dropping to around $0.52, its lowest margin since April 2022, but still elevated against the pre-pandemic normal between $0.35-$0.45.
The rate spikes in the final week of June coincide with normal seasonality as customers and shippers face typical headwinds that come with the end of the month, the end of the quarter and a holiday week all at once. Holiday promotions volume, the final sales push ahead of closing the books for the month and quarter, and the decrease in capacity from drivers taking extended time off to celebrate the 4th of July creates the perfect storm for rates to spike. Produce shipping demand has also contributed to the rise in rates over the last two months, although in a reduced capacity compared to previous years. According to DAT, produce season is typically responsible for a $0.25/mile rate increase between mid-April and July 4th weekend. However, the increase this year was only about $0.14/mile. Annual domestic produce volumes are down by about 4% YoY per the USDA, with the difference made up through increased imports via Mexico indicating excess capacity continues to suppress significant rate growth.
Truckload Demand
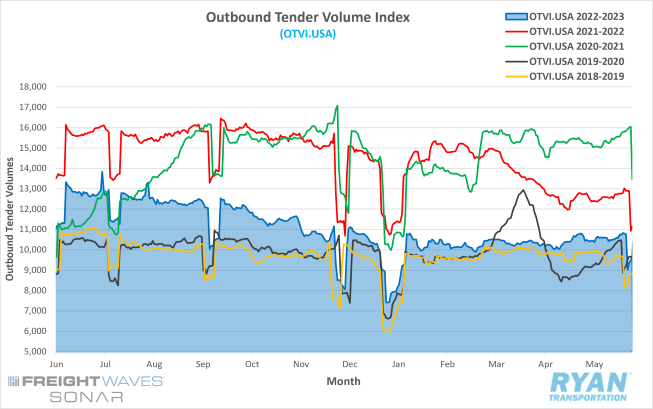
- The FreightWaves SONAR Outbound Tender Volume Index (OTVI), which measures tender volumes across all modes, saw a 10.3% increase over the course of June.
- The monthly average of daily tender volumes recorded by the OTVI saw a slight improvement in June, rising 1.8% to 10,640.4 from the average recorded in May of 10,447.7.
- Compared to previous years, the OTVI sits 15.2% below 2022 levels and 12.0% below the 5-year average.
- After seeing a significant increase in May and strong WoW improvement in the final week of June, spot market activity resumed its negative trend, with volumes falling 6.1% MoM and sitting 54.4% below 2022 levels.
- The Cass Freight Index, which analyzes the number of freight shipments in North America and the total dollar value spent on those shipments, recorded YoY decreases in June for both shipments and expenditures of 4.7% and 24.5% respectively.
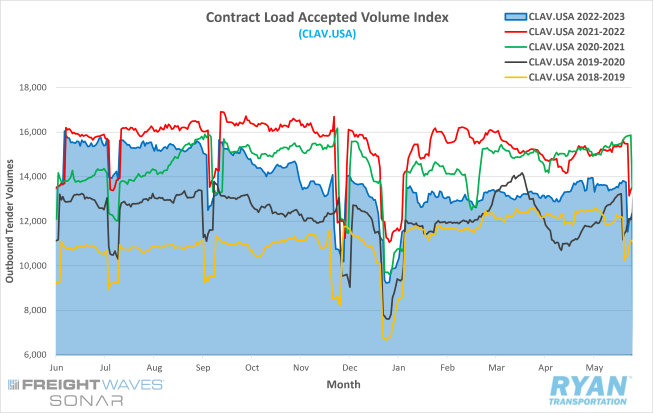
After starting the month off soft during the week following the Memorial Day holiday, volumes surged over 18.6% at the start of the second week in June to reach their highest level since November 1, 2022. The spike was short-lived, as tenders tapered off through the rest of the month to end about 7% below their high point, while daily volumes in June remained roughly 3-5% above the 2023 average. Like the week leading up to Memorial Day, spot market activity gained traction in the final week of June due to reduced capacity and additional tenders falling outside of normal routing guides or allotted contractual volumes for carriers. Looking below at the FreightWaves SONAR Contract Load Accepted Volume Index (CLAV), which measures accepted load volumes moving under contracted agreements minus the rejected tenders, volumes ended the month 9.3% above where they started but were 13.0% below the same time last year. The YoY decline in CLAV confirms that weakening demand is primarily responsible for driving total volumes down, which is reflected in the OTVI and not just the decline in rejected tenders. As a result, carriers are having to work that much harder to protect dwindling awarded contract volumes while providing further discounted rates to capture additional business to retain market share.
Truckload Supply
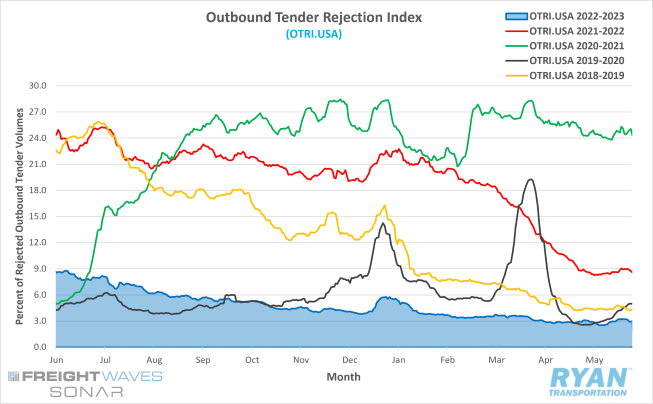
- The FreightWaves SONAR Outbound Tender Rejection Index (OTRI), which measures the number of contracted loads rejected by carriers expressed as a percentage, registered 3.87% to close out June, which was up 91 basis points (bps) from where it started.
- The increase in rejection rates seen in June is the largest since December 2022, with the index reaching levels not seen since the third week of January.
- June’s average rejection rate was 4.9% below the average for the same time last year and almost 10.7% below the 5-year average.
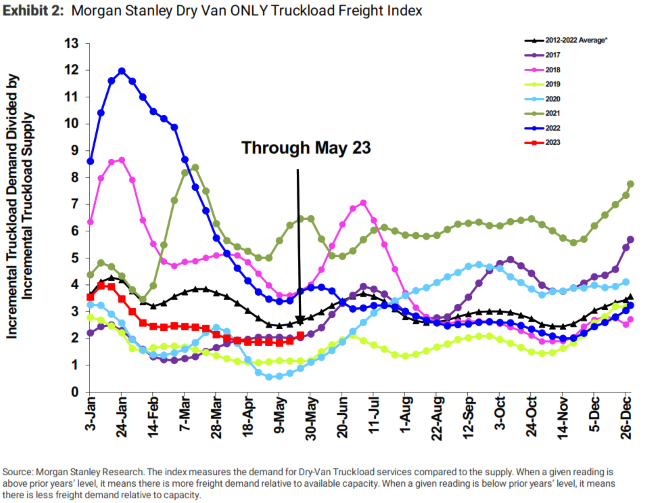
- Following three consecutive readings of outperformance, the Morgan Stanley Truckload Freight Index (MSTLFI) decreased sequentially in June and underperformed seasonality. The index remained below the long-term average and deviated further from it in June, after narrowing the gap in May.
The pattern of trends established through the first six months of 2023 are moving in a similar fashion to those seen during the over-supplied market of 2019, when the industry experienced its last recession. Holiday disruptions, among a few other outlying factors, appear to be primarily responsible for keeping tender rejection rates from matching and surpassing the current floor that was set in mid-May. Following the Memorial Day holiday, the OTRI resumed its negative trend through the first two weeks of June. The year’s traditional peak in volumes and rates ahead of Independence Day, barring the December holidays, propped the index back up to hit 3.88% and its highest level since January 16 of this year. The marginal spike in both demand and rejection rates, given the significance that the final week of June (Week 26) has on the market, creates further concern for the outlook over the next few months where disruptions are rare. In the last five years, rejection rates between the end of June and the beginning of August have dropped by an average of 2.4%, but removing the pandemic years sees the average decline move to 4.8%.
Truckload Capacity Outlook
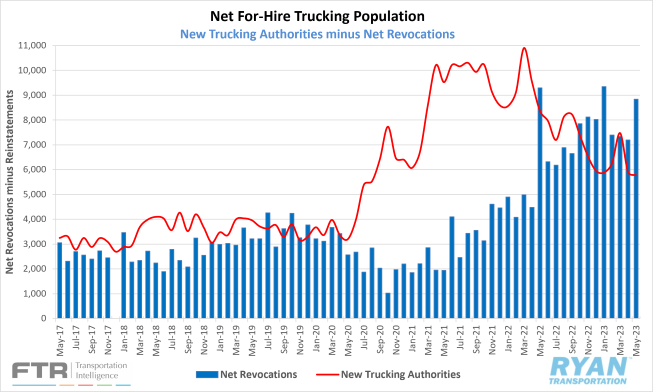
- According to FTR’s preliminary analysis of the Federal Motor Carrier Safety Administration’s (FMCSA) data for June, net revocations, which is the total revocations of operating authority minus reinstatements, fell by nearly 24% MoM to 6,751.
- The number of new authorities, newly authorized for-hire trucking companies, the FMCSA registered in June was up slightly to 5,994 from May and April.
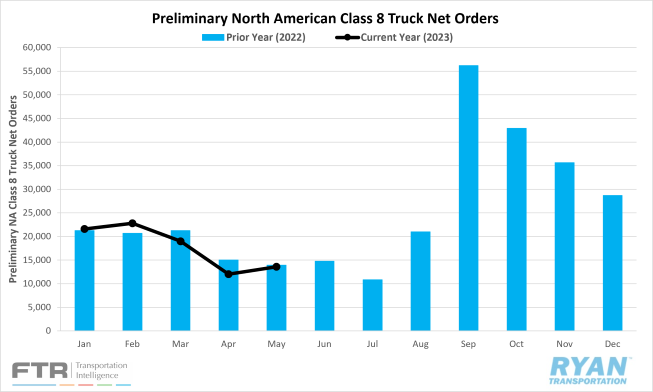
- Preliminary Class 8 orders were mixed in June but beat expectations for the second straight month, registering 13,800 units, which is essentially flat from May and down 7% YoY, according to FTR intel.
Net revocations exceeded new authorizations by 757 in the for-hire carrier population for June, marking a negative net change in eight of the last nine months, per FTR’s reporting of FMCSA’s June data. New authorities have remained stable over the last three months, while net revocations saw a considerable decline in June when compared to May. As mentioned in our last update, timing is everything regarding revocations. They are processed by the FMCSA in batches of 1,000 or more across four or fewer days for most months. The elevated figures reported in January and May were outliers, as both months showed five such days that included the first and next-to-last business days. June featured just four days, with the final one being June 26th, according to FTR. While the lower number recorded in June could be a result of market stabilization for smaller carriers, it could also simply be a function of the calendar. Active utilization currently sits roughly 4% below the 10-year average of 92% at 87.9% and is expected to remain flat around 87%-88% through early next year, according to FTR.
Fuel Prices
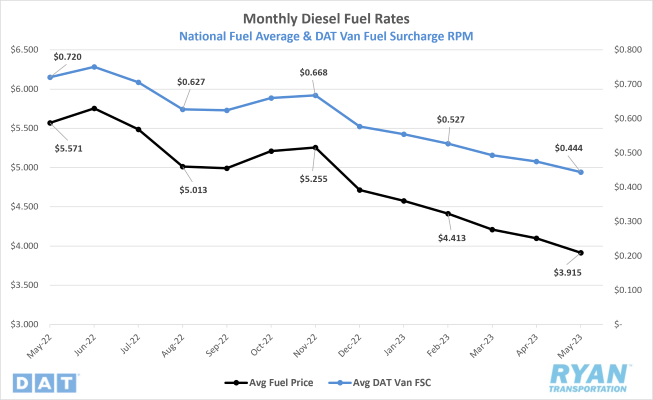
- The national average fuel price declined for an eighth straight month in June, falling 2.9% from the average in May to $3.802.
- The average price of diesel has now fallen 33.9%, or $1.952, from its $5.754 peak in June 2022.
- Since the start of the year, weekly fuel prices have posted declines in 21 of the last 26 weeks.
- Crude Inventories decreased by just over 7M barrels (bbl) in June, outperforming the -1.9M consensus for the weeks ending June 2 and June 30, according to the EIA.
Since the last increase in mid-April after Easter weekend, the national average fuel price declined for the next eight consecutive weeks. Prices dropped $0.322/gallon before seeing another increase of just $0.021/gallon in the week following Juneteenth, according to reporting from the Energy Information Administrations (EIA). Prices surged in the week after a rally in diesel futures but were short-lived as the negative trend continued in the last week of June, dropping another $0.034/gallon. The U.S. stockpile of crude products fell in June as draws exceeded build for both commercial crude and the Strategic Petroleum Reserve (SPR), indicating some growth in demand likely as a result of the warmer driving months. Most of the decrease occurred in the week ending June 23, as draws of 9.6M bbl exceeded the 1.8M bbl expectations. Despite the decrease in reserves, crude prices remained largely unaffected as Brent Crude continued to hover around $75/bbl, while West Texas Intermediate (WTI) stayed around $70/bbl. A recent report from S&P Global Commodity Insights noted the initial 1M bbl/day production cuts announced by OPEC+ that went into effect at the beginning of May ended up closer to 670,000 bbl/day in the first month of implementation. With the reduction of global supply not having the desired impact on prices, Saudi Arabia announced an additional 1M/day decrease in production that would go into effect in July. The leading oil producing country in OPEC recently announced they would extend the July production cut through August, with hopes of pushing global prices back up near $90/bbl.
Global demand levels face multiple headwinds, impeding any significant growth from matching elevated supply levels in the near- to mid-term outlook. Rising interest rates from the Federal Reserve causing higher costs is a leading factor, while the weak rebound of China’s manufacturing sector remains the other primary factor. Despite concerted efforts from OPEC+ to reduce output, global supply levels have stayed elevated due to increasing exports from Iran and Russia. In February, Russia pledged to join its fellow OPEC+ nations and reduce production by 500,000 bbl/day by May 1, before the Russian administration suspended publishing statistics for oil and natural gas production in March. According to Bloomberg research, however, Russia has reduced production by 212,000 bbl/day from its peak on May 21 but remains roughly 250,000 bbl/day above the February baseline. Meanwhile, Iranian oil, which is technically under sanctions, is currently sitting at a four-year high while exports were at a five-year high in May. China, the world’s second largest consumer of oil products, reportedly imported approximately 1.4M bbl/day of Malaysian oil in May, recording its third highest level of imported oil of all time. Since total Malaysian exports are around 400,000 bbl/day, many analysts speculate that most of these imports are Iranian oil under disguise. While consensus is bearish, some analysts argue there is potential for the near-to mid-term outlook to turn bullish. This is due to the extension of additional production cuts by Saudi Arabia during the warmest time of the year, when travel is elevated while the use of air conditioning is at its highest.
Dry Van Overview
Spot Rates
- The national average dry van spot rate excl. fuel rose by 2.8%, or $0.045, MoM in June to $1.650.
- The national average dry van contract rate excl. fuel decreased by 0.7%, or $0.016, MoM in June to $2.155.
- Linehaul spot rates for dry vans in June were 14.5% below the same time in 2022 and 10.3% below the 5-year average.
Load-to-Truck Ratio
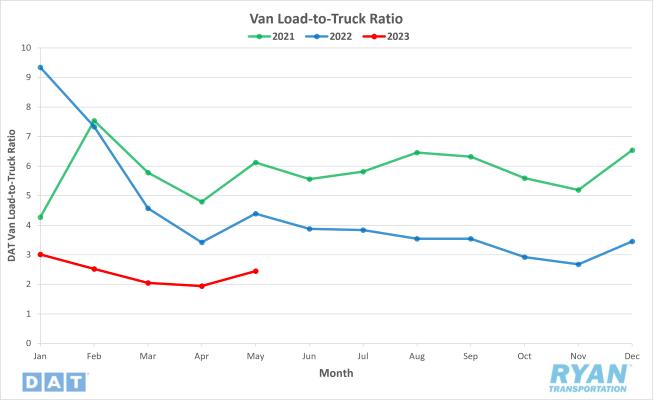
- The dry van load-to-truck (LTR) ratio increased 5.8% MoM in June but was down 33.2% YoY.
Market Conditions
The final week of June typically represents peak rates and volumes for the dry van sector outside the December holiday period. On a WoW basis, dry van linehaul spot rates have increased only six times through the first 26 weeks of 2023. The final week of June registered a $0.04/mile increase from the previous week, making it the second highest jump in dry van rates so far with the first coming in the week of International Roadcheck, when rates spiked $0.09/mile. The $0.04/mile increase put van rates 12.7%, or $0.25/mile, below where they started the year and the same week last year but sit $0.11/mile higher than 2019 levels. Per DAT, during a typical year between mid-April and 4th of July weekend, the impact of produce on dry van rates is an increase of roughly $0.18/mile while this year, like 2019, only increased roughly $0.09/mile.
Reefer Overview
Spot Rates
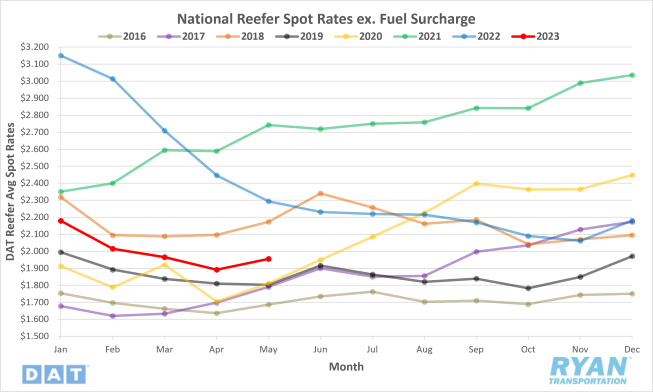
- The national average reefer spot rate excl. fuel increased 2.8%, or $0.055, MoM in June to $2.010.
- The national average reefer contract rate excl. fuel saw little monthly change in June, dropping 0.2%, or $0.004, to $2.416.
- Reefer linehaul spot rates ended June 9.9% below June 2022 levels and were 7.6% below the 5-year average.
Load-to-Truck Ratio
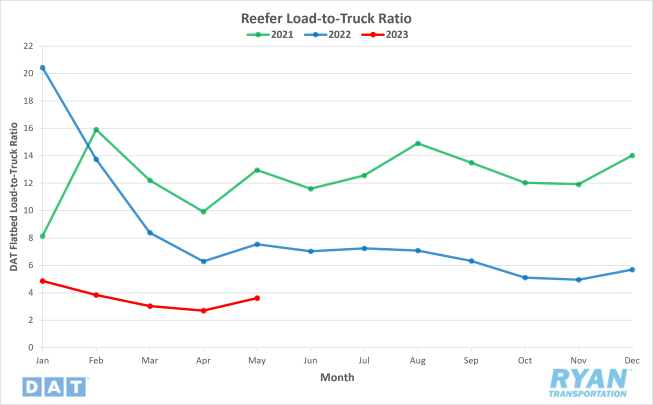
- The reefer load-to-truck (LTR) ratio increased 5.8% MoM in June and sits 45.5% below June 2022 levels.
Market Conditions
Similar to the dry van sector, refrigerated carriers are typically the largest beneficiary of the additional volumes seen in the final week of June. In a typical year, according to DAT, reefer spot rates excl. fuel are approximately $0.25/mile higher than mid-April levels by the time 4th of July rolls around. This year, however, the impact from produce was below par, increasing only $0.14/mile by week 26. Since the beginning of the year, refrigerated spot rates have only increased four times WoW, with the $0.04/mile increase in the last week of June registering as the second highest so far. The refrigerated market continues to perform the worst overall this year, with linehaul rates ending the month 18.6%, or $0.43/mile, below where they started the year but sit $0.12 above the same time in 2019. One positive for the near-term outlook is the continued reliance on produce imports from Mexico, due to U.S. volumes remaining below annual averages. Imports from Mexico were up 49% YoY in June to make up for California’s 30% drop in YoY production.
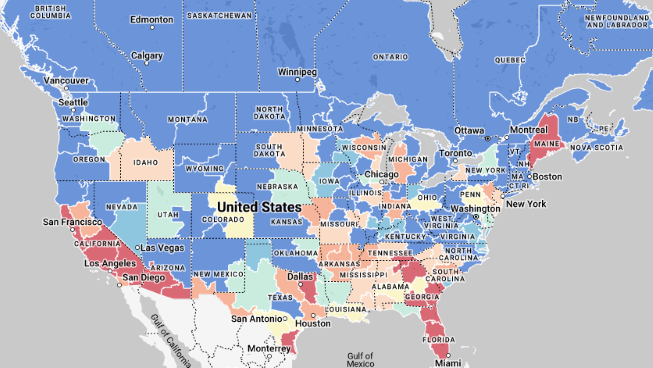
Flatbed Overview
Spot Rates
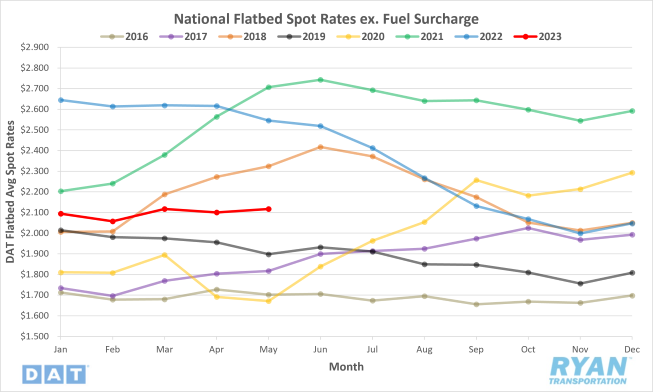
- The national average flatbed spot rate excl. fuel decreased slightly MoM in June, dropping 0.6%, or $0.013, to $2.104.
- The national average flatbed contract rate excl. fuel fell by 1.5%, or $0.042, MoM in June to $2.730.
- Flatbed linehaul spot rates were down 16.5% YoY and were 5.5% below the 5-year average.
Load-to-Truck Ratio
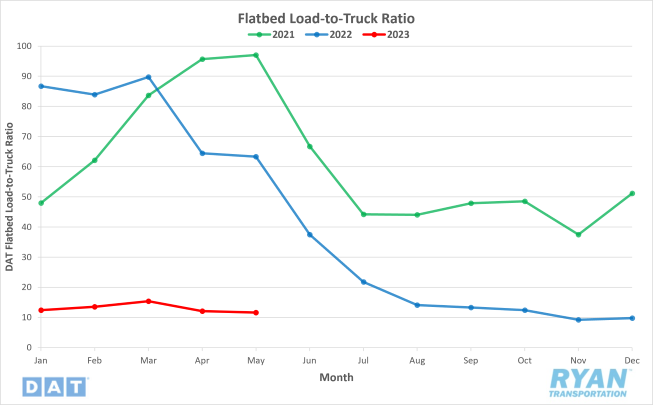
- The flatbed load to truck (LTR) ratio fell 17.2% MoM and was down 74.2% YoY.
Market Conditions
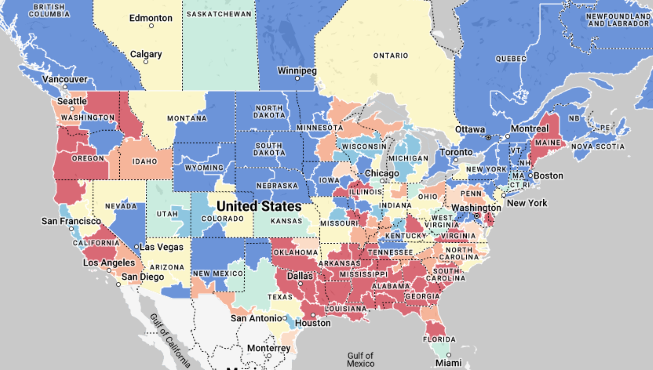
Flatbed activity struggles to find any traction in 2023 despite being in the midst of normal peak shipping for the sector. Two weeks after recording the largest WoW increase of the year at $0.07/mile, flatbed spot rates excl. fuel dropped $0.05/mile for the largest WoW decrease in the first week of June. Unlike the other two modes, the final week of June carries less weight on rates and volumes, so the $0.01/mile WoW increase is out of line with seasonality. Despite no significant impacts from peak shipping so far this year, flatbed linehaul rates finished the month just 3.7%, or $0.08, below where they opened the year. The decline in fuel prices continued to be a major factor in the lackluster flatbed market performance in June, as companies continue to take drill rigs offline. The total oil and gas rig count is an early indicator of future output and flatbed demand for drilling products. The total active drill rig count in the U.S. fell by 22 in June, dropping the total count to its lowest point since April 2022.
Intermodal
Spot Rates
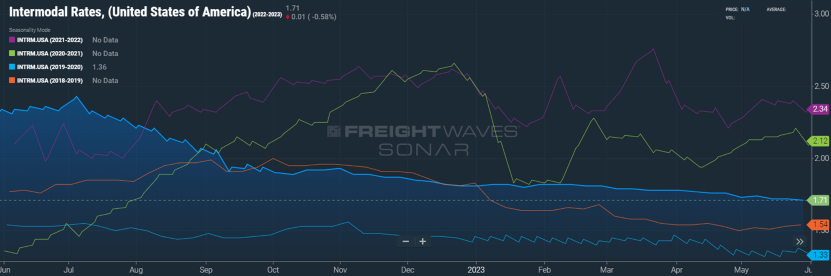
- The FreightWaves SONAR Intermodal Rates Index (INTRM.USA), which measures the average weekly all-in door-to-door intermodal spot rate for 53’ dry vans across a majority of origin-destination pairings, fell further in June, dropping another $0.02 from $1.71 to $1.69 and sits 28.1%, or $0.66, below 2022 levels.
- Compared to the 5-year average, the INTRM.USA sits 9.7%, or $0.18, below.
Volumes
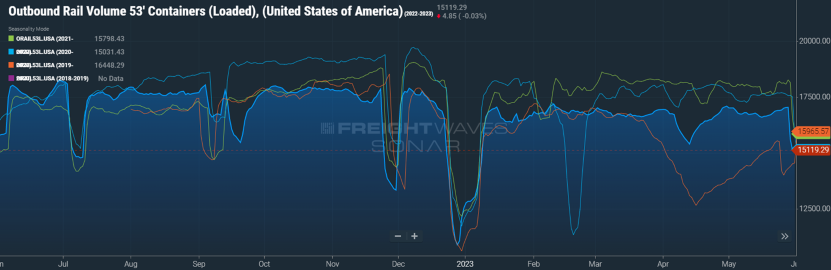
- Total loaded volumes for 53’ containers from all domestic markets, measured by the FreightWaves SONAR Loaded Outbound Rail Volume Index (ORAIL53L.USA), was virtually flat through June, increasing 2.5% in the week leading up to the 4th of July.
Less than two weeks after the West Coast port negotiations ended in a six-year deal, the International Longshoreman and Warehouse Union (ILWU), which represents dock workers at Canada’s major ports, issued a 72-hour strike notice that created further headaches for shippers and carriers. The work stoppage was set to take place on July 1 and would result in a significant hit to rail volumes just as they started to see some positive momentum. In the final week of June, weekly carload volumes were averaging around 325,000 and consistent with much of the second quarter. While weekly volumes remain well below historical averages, it is an improvement from the 300,000-weekly average in the first quarter. After hitting a record low of 7.75% on May 20, the FreightWaves SONAR Intermodal Contract Savings Index (IMCSI1.USA), which measures the average percent difference between all-in intermodal contract rates and all-in truckload rates in the same lane, rebounded 71 basis points in June to end the month at 8.46%.
Further Reading
- Dockworkers at Canada’s West Coast ports launch strike – FreightWaves: American Shipper
- Produce Season Fails to Boost Struggling Freight Market – Transport Topics
- Preliminary June Class 8 orders are mixed – Logistics Management