
Executive Summary
Front-page headlines and economic data remain at odds as to the current and future state of the economy, with key indicators each painting different pictures. Consumer spending increased in July, with goods spending finally outpacing services spending once again despite rising prices fueled by increasing energy costs. Employment growth cooled in August, as the unemployment rate ticked up to 3.8%, while at the same time payroll numbers rose following sharp downward revisions to June and July’s data. Housing starts and new-home sales rose in July while existing-home sales fell and mortgage rates continued to increase. All key metrics have to be factored into the Fed’s decision on whether it prioritizes a soft landing or its initial 2% inflation target, neither of which will appear to happen at the same time. For the truckload market, the deteriorating conditions continue to be drawn out by the oversupply of capacity, which remains despite declining rates and rising fuel prices. Imports were in line with typical seasonality trends in August, rising 0.4% MoM and sitting 2.5% above August 2019 levels, as overall TEUs registered just under 2.2M. While the second consecutive month of growth in imports is tracking historical standards, the outlook for anything more than another muted peak season remains bleak.
Main Takeaways
- U.S. manufacturing activity continued to contract in August, but at a slower rate than July as production moved back to breakeven territory.
- Employment in the trucking sector decreased sharply last month following the closure of Yellow Corporation, as the nation’s third largest less-than-truckload provider laid off all 30,000 employees in its workforce.
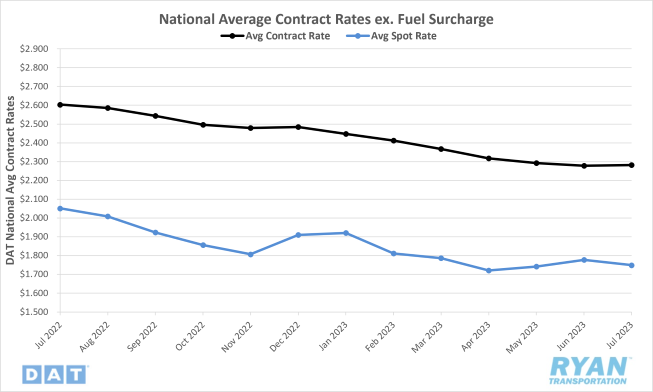
- Declines in average linehaul contract rates outpaced the drop in linehaul spot rates, narrowing the contract-to-spot spread to just over $0.52.
- Load tender rejection rates moved above 4% towards the end of August for the first time in over seven months.
- The carrier population declined by 1,129 carriers, significantly less than the decline recorded in July of 1,938.
- The national average price of fuel increased $0.348 per gallon and has risen $0.726 per gallon since the second week of July.
Use the links below to jump to specific sections:
Economy | Spot Rates | Truckload Demand | Truckload Supply | Fuel Prices | Dry Van Overview | Reefer Overview | Flatbed Overview
Economy
United States ISM Manufacturing PMI
Key Points
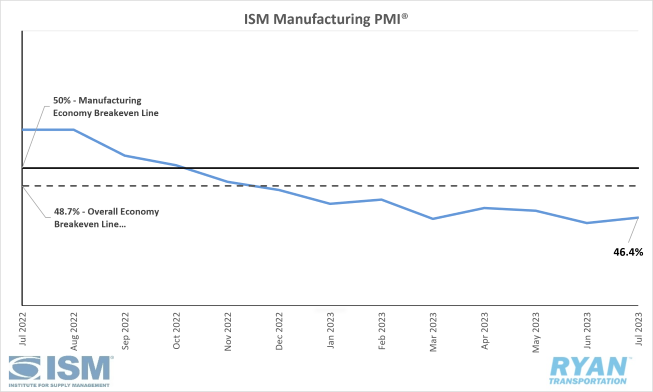
- The Institute of Supply Management (ISM®) Manufacturing PMI® contracted in August at a slower pace, registering 47.6%, a 1.2 percentage point increase from July’s reading of 46.4%. August marks the tenth consecutive month of contraction in the manufacturing sector and the ninth consecutive month of contraction with regards to the overall economy.
- The New Orders Index contracted further in August at 46.8%, a 0.5 percentage point decrease from July’s figure of 47.3%.
- The Backlog of Orders Index registered 44.1% in August, 1.3 percentage points higher than the 42.8% recorded in July.
- The Production Index increased 1.7 percentage points from July’s reading of 48.3% and registered 50.0% in August.
- The Employment Index remained in contraction territory but saw a 4.1 percentage point increase in August from July to 48.5%.
- The Prices Index registered 48.4% in August, a 5.8 percentage point increase from July’s figure of 42.6%.
Summary
While the U.S. manufacturing sector remains in contraction territory, the month-over-month (MoM) uptick in the ISM Manufacturing PMI® indicates a slower rate of contraction in August compared to July. Companies are continuing to manage outputs as demand and orders remain soft, but the increase in the composite index is a sign of improvement. The demand components of the index eased as the New Orders Index continued to shrink, while Backlog of Orders showed signs of improvement for the third straight month but remain at low levels, according to the ISM® report. The August reading of the Customers’ Inventories Index indicates an appropriate level of tension exists between buyers and suppliers, which has a neutral to slightly positive impact on future production levels. The output/consumption components, reflected in the Production and Employment Indices, were positive overall, with signs pointing towards a potential return to expansion territory in the future. Production levels were stable compared to July and consistent with reduced output to match companies’ order books, as the Production Index moved back to breakeven in August. The MoM increase in the Employment Index indicates companies were effective in managing headcounts in August, primarily through attrition, per the ISM®. While the Prices Index remained in ‘decreasing’ territory in August, the 5.8% increase over July’s reading indicates prices are stabilizing, as the input components of the PMI® continue to support future demand growth.
Why it Matters:
The slower rate of contraction in the August Manufacturing PMI® provided some positive signals for the manufacturing industry, but noted a number of headwinds the sector faces before it can return to expansion territory. Although last month’s figure outperformed the consensus of 47.0%, weakening demand continues to be the primary driver keeping the PMI® in contraction territory, as the sharp fall in new orders indicates demand levels softened in August compared to July. Output and consumption were both slightly better in August compared to the previous month and can have a positive impact on future growth. However, with a decline in new orders, manufacturers will likely be forced to continue to scale back output to match softening demand levels expected in the near future. Half of the six biggest manufacturing industries saw growth in August, including Transportation Equipment; Food, Beverage & Tobacco Products; and Petroleum & Coal Products. Sentiment for a return to growth within the industry remains mixed across survey panelists, with many showing pessimism towards a return to growth before the end of the year.
Macro Impacts
-
The future for monetary policy, and the Federal Reserve’s decision to keep the federal funds rate where they are at or continue their battle with inflation, remains up for speculation following the latest round of economic data releases.
- According to the CME Fedwatch Tool, the current consensus of interest rate traders reflects a 93.0% probability that rates remain at the current 5.25%-5.50% target rate level, with 7.0% predicting another 25-basis-point rate hike at the Fed’s next meeting on September 20.
- The Personal Consumption Expenditures Index (PCE), the Fed’s preferred inflation gauge, rose less than expected in July with headline and core PCE both rising 0.2% on a monthly basis, according to the most recent report released by the Bureau of Economic Analysis (BEA).
- Headline PCE increased 3.3% on an annual basis in July while core PCE, which excludes food and energy, rose 4.2% YoY.
- The PCE Index registered a 3.7% increase YoY in Q2, down from the 4.9% annual rise recorded in Q1 but far from the Fed's 2.0% target. Core PCE dropped from 4.7% in Q1 to 4.4% in Q2.
- Headline PCE increased 3.3% on an annual basis in July while core PCE, which excludes food and energy, rose 4.2% YoY.
- In a recent survey, the Fed remained hawkish regarding further increases, pointing toward inflation levels still measuring above the 2.0% target rate. This left many to speculate on the Fed’s unwillingness to move their goal posts, despite the softening labor market numbers and banks tightening lending limits.
- Headline and core inflation both rose MoM by 0.6% and 0.3% on a seasonally adjusted basis, according to the latest Consumer Price Index report released by the Bureau of Labor Statistics (BLS).
- The All Items index increased 3.7% for the 12 months ending in August, up from the 3.2% increase recorded in July.
- The All Items Less Food and Energy Index increased 4.3% for the 12 months ending in August, down from 4.7% in July.
- Gasoline was the largest contributor to the monthly increase in headline CPI, accounting for over half of the increase. The Energy Index rose 5.6% in August.
- The All Items index increased 3.7% for the 12 months ending in August, up from the 3.2% increase recorded in July.
- According to the CME Fedwatch Tool, the current consensus of interest rate traders reflects a 93.0% probability that rates remain at the current 5.25%-5.50% target rate level, with 7.0% predicting another 25-basis-point rate hike at the Fed’s next meeting on September 20.
- Total nonfarm payroll rose by 187,000 jobs, seasonally adjusted, in August according to the latest Jobs Report release from the Bureau of Labor Statistics (BLS).
- The unemployment rate rose 0.3% on a monthly basis to 3.8% in August, according to the BLS.
- The transportation and warehousing sector saw a sharp decline in August on a seasonally adjusted basis, shedding more than 34,000 jobs with Truck Transportation providing the most significant impact, losing just under 37,000 jobs.
- The sharp decline in jobs within the transportation industry was expected following the recent closure of Yellow Corp. at the end of July, which resulted in the immediate layoff of its roughly 30,000 employees at the time.
- It is likely that the BLS captured the entirety of the Yellow. layoffs in the August data, but that will not be clear for at least another month when the BLS releases a more detailed breakdown of its findings.
- Removing the data from the Yellow closure to get a more accurate picture of the industry as a whole, the transportation industry lost 5,700 jobs on a seasonally adjusted basis, which is a significant downturn from the normal August seasonal average of an increase in 5,700 jobs.
- The sharp decline in jobs within the transportation industry was expected following the recent closure of Yellow Corp. at the end of July, which resulted in the immediate layoff of its roughly 30,000 employees at the time.
- The unemployment rate rose 0.3% on a monthly basis to 3.8% in August, according to the BLS.
Industry Overview
August Key Figures (YoY)
| Truck Data Points | YoY Change (%) |
|---|---|
| DAT Spot Rates (incl. FSC) | -17.3 |
| Fuel Prices | -12.8 |
| ACT Class 8 Preliminary Orders | -9.0 |
| ATA NSA Truck Tonnage | -3.1 |
Spot Rates
Key Points
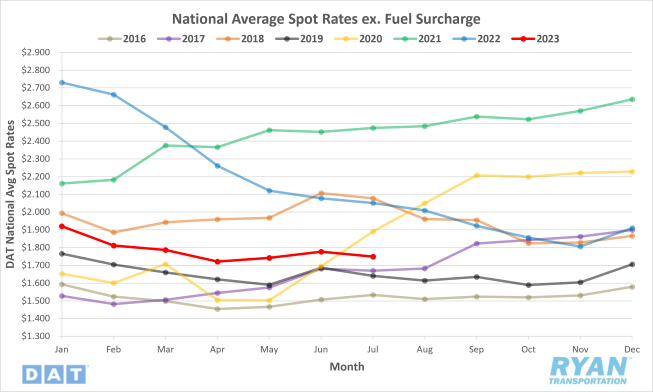
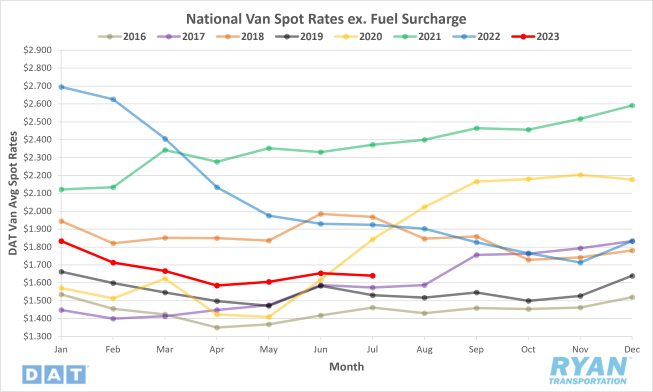
- The national average spot rate excl. fuel fell for the second consecutive month, dropping 4.1%, or $0.071, in August from July.
- National average linehaul rates were down 17.3% YoY and registered 15.4% below the 5-year average.
Contract Rates
Key Points
- The national average contract rate excl. fuel fell 3.2%, or $0.073, MoM in August and sits 15.5% below the same time in 2022.
- The contract-to-spot spread narrowed slightly in August, dropping just 0.5%, or $0.002, from the previous month.
Summary
National average rates excl. fuel declined further in August, as excess truckload capacity outweighing demand continues to pull rates down. The 7-day average national linehaul rate registered a 3.2%, or $0.06, decline in the first two weeks of the month when rates generally see an uptick as a result of the back-to-school shopping season. The final week of the month leading up to Labor Day weekend brought some positive momentum for rates, as the 7-day average gained $0.03 but ultimately ended the month down $0.02 from where it had started. Despite the late rally, the national average linehaul rate last month has now dropped spot rates below the previous lows recorded in April and May of this year. Spot market rates excl. fuel remain in line with 2019, with rates in August registering just 3.1% above August 2019 levels and are at their lowest levels since May 2020 during the pandemic. The contract market continues to see negative pressure caused by deteriorating spot market conditions, as the national average contract rate excl. fuel experienced its largest MoM decline since the initial downturn of the truckload market last year. After downward revisions were made to July’s data, the national average contract rate excl. fuel has now fallen in 17 of the last 18 months. The drop in contract rates outpaced the decline in spot rates, narrowing the contract-to-spot spread slightly, however, it still remains elevated against the pre-pandemic average. In order for the market to return to balance, it will require $0.28 in either lower contract rates and/or higher spot rates, per a recent ACT Research report.
Why It Matters:
From a historical standpoint, the monthly decline in truckload rates in August was not entirely uncharacteristic for this time of year. Prior to the pandemic, average linehaul rates saw roughly a 2.2% decrease between July and August. Following the Fourth of July until mid-September, when peak maritime season ramps up, overall freight activity slows, putting downward pressure on the inflated rates from produce demand and holiday disruptions observed in the prior months. The 4.1% MoM decline in linehaul spot rates between July and August of this year was the second most significant in the last 10 years. The first came in 2018, when the market was coming off a record-high surge in rates that June, from the influx of produce volume in an otherwise under-supplied market at the time. Excess capacity has remained persistent so far this year, despite the weak demand environment and deteriorating rate conditions. However, as rates have now fallen below the lows initially set in April, when many believed was the bottom of the market, it is unlikely that the current capacity situation will be able to last much longer. For most mid- to small-sized fleets with increased exposure to spot market activity, current rates are no longer operationally sustainable, especially as fuel prices continue to rise at their current pace.
Truckload Demand
Key Points
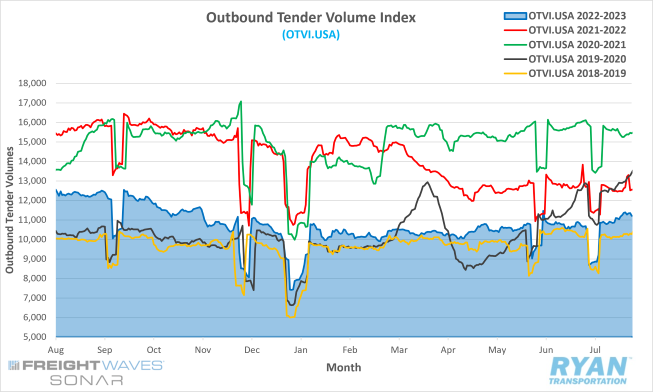
- The FreightWaves SONAR Outbound Tender Volume Index (OTVI), which measures tender volumes across all modes, registered 11443.72 on August 31, a 2.1% increase from where it started the month.
- The monthly average of daily tender volumes in August, recorded by the OTVI, was up 6.8% over the July average, increasing from 10509.68 to 11227.62.
- The average daily tender volume in August was 9.0% below the same month last year and sits 11.1% below the 5-year average.
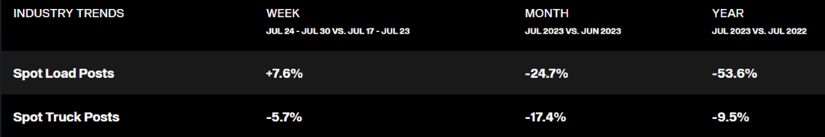
- After spot market activity rebounded from the nearly 25% MoM decline registered in July to end August up 12.5% MoM, but still remain 41.1% below 2022 levels.
Summary
Following a bump in tender activity toward the end of July, volume levels were relatively constant throughout most of August, despite consumer spending on retail goods weakening midway through the month. Primarily driven by an early start to back-to-school shipping demand, tender volumes measured by FreightWaves SONAR OTVI registered a 1.8% increase through the first half of August. As consumer spending on retail goods slowed toward the middle of the month, demand levels responded by dropping 1.5% WoW. This was until last-ditch Labor Day promotional sales propped up volumes in the last week to end the month just below where they were at the halfway point. Compared to the same time last year, the OTVI was down roughly 8.2% at the end of August. While contract market activity held steady in August, the same could not be said for the spot market, as WoW demand levels continued to experience significant volatility. According to data sourced from DAT, spot volumes jumped roughly 3% early in the month, driven primarily by reefer and dry van activity. Volumes saw a sharp decline in the third week, as back-to-school demand tapered off with dry van volumes falling 13% WoW and flatbed demand registering just over 22% below the week before. While the 12.5% MoM gain in spot load posts in August is a positive sign, it comes on the heels of the nearly 25% MoM decline registered in July, making the gains appear much less out of reach.
Why It Matters:
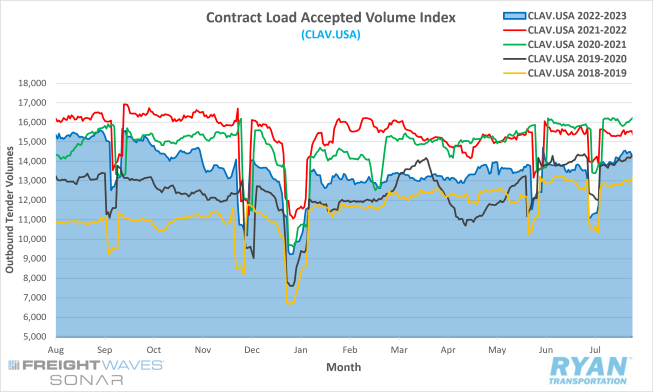
In a normal market, and most abnormal markets, demand levels ahead of holidays all typically follow the same seasonal pattern. Volumes experience moderate increases, beginning a few weeks out from the holiday before taking a generally sizeable jump in the immediate week leading up to the holiday. The final week push, when shippers look to clear inventory tied to promotional sales, coincides with capacity disruptions from drivers taking time off and causes volumes to shift out of normal routing guides and onto the spot market. The moderate increase in contract volumes registered by FreightWaves SONAR OTVI during the final week likely reflects this push from shippers, but was far less significant than what was experienced in the weeks leading up to past holidays. Spot volumes turning negative during this last week indicates the additional volumes were easily absorbed by carriers under contract without disrupting their current network. While the FreightWaves SONAR Outbound Tender Volume Index is a good gauge of national freight demand based on shippers’ requests for capacity, it includes both accepted and rejected tenders and can be skewed by significant shifts in rejection rates. To get a more accurate representation, the FreightWaves SONAR Contract Load Accepted Index (CLAV) represented in the chart below, which is similar to the OTVI but removes the rejected tenders, volume levels that were accepted under contract changed very little in August as the index only registered a 0.1% increase during the month. However, it remains 6.7% below last year’s levels, ensuring monthly and yearly differences registered by the CLAV continue to confirm that actual cracks in freight demand are keeping volumes deflated.
Truckload Supply
Key Points
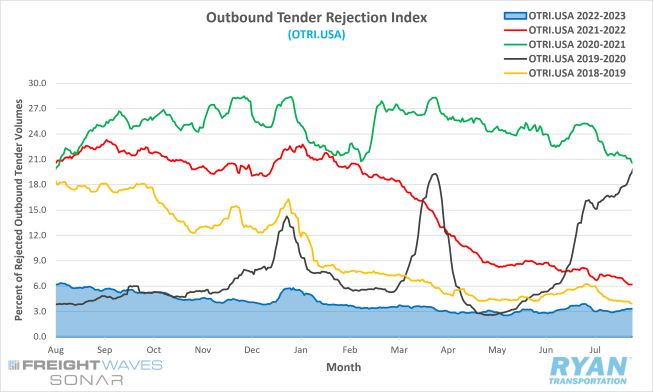
- The FreightWaves SONAR Outbound Tender Rejection Index (OTRI), which measures the number of contracted loads rejected by carriers and reflects it as a percentage, increased just over 1.0% throughout August to end the month just under 4.4%.
- The monthly average of daily rejection rates in August was 3.74%, a 53-basis-point increase from the 3.21% average recorded in July.
- Outbound rejections surpassed 4.0% towards the end of August for the first time since January 15 of this year.
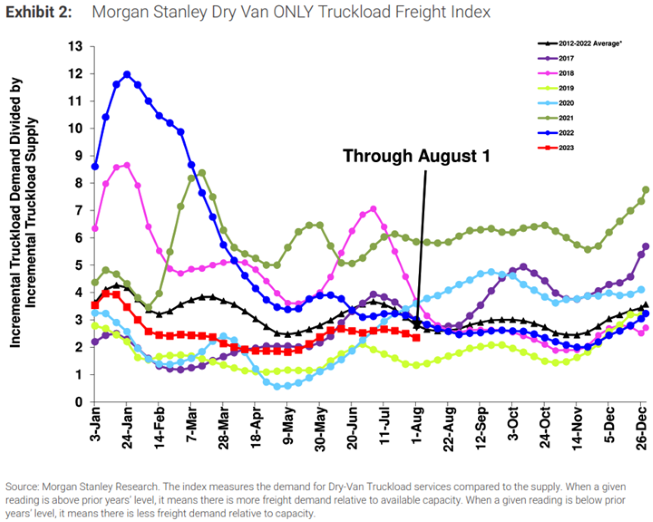
- The Morgan Stanley Truckload Freight Index (MSTLFI) recorded sequential increases in the second half of August for the first time since June and performed in line with seasonality. While the demand component of the index continued to decline and underperform seasonality, the supply component turned negative for the first time in a month, indicating supply could be leaving the market.
Summary
The truckload supply conditions showed signs of improvement late in the month but continued to steadily outpace overall demand conditions. Tender rejections, measured by the OTRI, gained positive momentum in the week leading up to Labor Day, moving north of 4% for the first time in over seven months. On the final day of the month, the Outbound Tender Rejection Index, which measures relative capacity in the market, recorded its highest level of 4.39% since January 12, when the index registered 4.47%. Unlike the past several months, which saw early incremental gains cut short by a mid-month lull only to rise again in the final weeks, rejection rates in August steadily increased over the course of the month. The Rejection Index spiked 37 bps in the last week of August, the most significant increase during the final week of a month this year and the largest 7-day jump ahead of any 2023 holiday thus far. On an annual basis, the OTRI sat 114 bps below 2022 levels on August 31 with YoY comparisons becoming more favorable as the year progresses, even if OTRI remains stable.
Why It Matters:
The steady increase in tender rejections in August and spike ahead of the Labor Day weekend is a step in the right direction if the market is to find balance anytime soon. However, current levels remain much too low to drive any discernible change within the truckload market. According to FreightWaves, who established the OTRI, rejection rates generally need to be in the range of 5% to 7% for any noticeable disruptions to take place across major carriers’ networks. Volume density and capacity disruptions that occur during the fourth quarter holiday season create upward pressure on rejection rates and will likely push the index within that range, but only on a temporary basis. Unfortunately, for the OTRI to reach a sustainable level, it would require a surge in overall demand or a drastic reduction in excess capacity. With near-term projections remaining weak for the former, the desired change in the market will have to come at the hands of the latter.
Truckload Capacity Outlook
Key Points
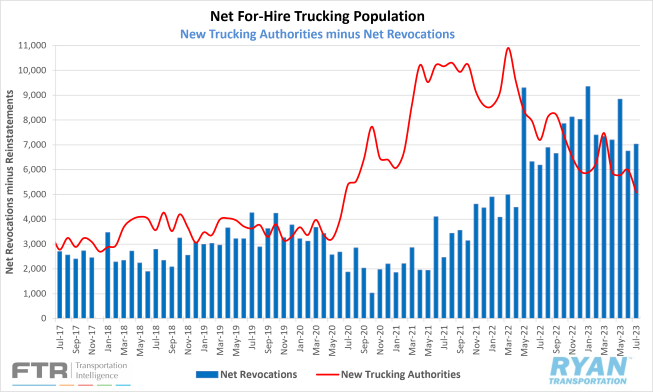
- Total net revocations – total authority revocations minus reinstatements – registered 6,409 carriers in August, an 8.8% decline from July’s figure of 7,030 and its lowest level since July of last year, according to FTR Intel’s preliminary analysis of the Federal Motor Carrier Safety Administration’s (FMCSA) data.
- Per FTRs data, the FMCSA authorized 5,280 new for-hire trucking companies in August, a 3.7% increase over the 5,092 new authorizations recorded in July.
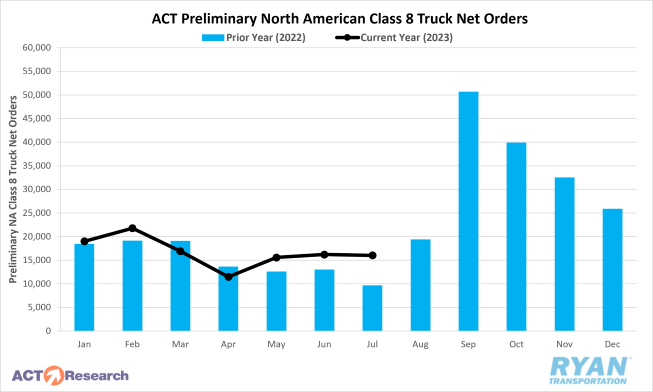
- Preliminary North American Class 8 Orders estimates in August registered between 15,400 and 19,000 units, and were down 9% to 26% YoY depending on the estimate.
Summary
The outlook for truckload capacity is no clearer based on the data released in August. Net revocations in for-hire trucking authorities continued to outpace new entrants in August, as the net change in the carrier population registered a decline of roughly 1,129 carriers. While the change in the carrier population in August registered below July’s decline of 1,938 carriers, it still remains high by historical standards. August marked the fifth consecutive month where revocations surpassed new entrants, with the carrier population having now declined in 10 of the last 11 months. Meanwhile, as for-hire trucking companies continue to exit the market en masse, Class 8 orders continue to be produced at maximum levels. Though August preliminary orders of 19,000 were down roughly 9% YoY, according to ACT Research’s estimate, it was the highest reading in the last six months. Per the ACT Research Class 8 report, YoY comparisons are likely to continue to underperform 2022 levels through November due to the record setting order activity that took place in the second half of last year. August is historically a weak month for Class 8 orders, as it typically caps off the four-month ‘weak order season’ that begins in May, according to the ACT Research report. Orders typically don’t begin to ramp up until September when OEMs open their 2024 books, causing ordering season to accelerate.
Why It Matters:
There appear to be opposing factors at play that are creating uncertainty around the fate of truckload capacity in the near future. On one side, the elevated revocation levels from the industry in the for-hire trucking sector month after month have been somewhat expected given the current state of the market. Depressed demand against a surplus of truckload supply has moved rates below breakeven levels and pushed many carriers, both big and small, to the brink of bankruptcy and many others to close their doors for good. The larger fleets that benefit from the higher-priced contract market have already absorbed what they can handle from a driver standpoint, as overall labor turned negative in the industry once the Yellow layoffs were scrubbed from the data. On the other hand, Class 8 tractor order numbers in August reflect that fleets are not shying away from ordering new equipment, which can be interpreted as a positive sign for the second half of 2023. According to ACT Research, publicly traded for-hire fleets reduced their collective tractor count by roughly 3% in the first half of the year. While that doesn’t mean they’ve completely cut off ordering new equipment, as they likely have older trucks that require replacing to meet updated compliance standards, it does mean that they are likely not solely responsible for the elevated demand in Class 8 orders. Much of the Class 8 demand in the past year has been driven by the rapid growth in the private fleet sector. According to the National Private Truck Council (NPTC), private fleets represent roughly 50% of the total number of fleets operating in the trucking industry, with big name companies like Amazon, PepsiCo, Sysco and Walmart holding some of the largest private fleets in the country. Based on a recent survey conducted by the NPTC, shipments hauled by private fleets increased 10.3% in 2022 with volumes rising 7.3% during the same time period. The continued addition of new trucks and drivers to the over-capacitated market by private fleets will ultimately prolong the imbalance of supply that has plagued the industry. Conditions aren’t likely to improve in the near-term until the pressure from private fleet growth eases.
Fuel Prices
Key Points
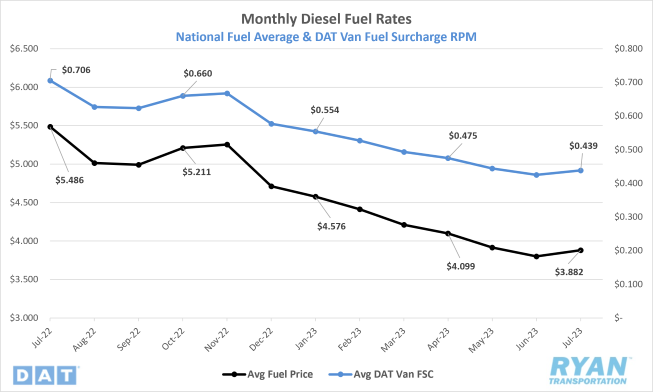
- The national average price of diesel increased for the second consecutive month in August, as the average fuel price jumped 12.6%, or $0.488, from July’s average to $4.370.
- Despite the large uptick in fuel MoM, the average price of diesel in the U.S. remained 12.8% below the same time in 2022.
- U.S. crude inventories continued to decline in August, as draws totaled 23.1M barrels (bbls) versus the 13.2M bbls consensus for the weeks ending August 4 and September 1, according to the Energy Information Administration (EIA).
- For the week ending September 1, total crude stocks, which includes both commercial and strategic petroleum reserves, registered its lowest level since April 1985 of just under 767M bbls, per data sourced from the EIA.
Summary
The additional production cuts from Saudi Arabia and Russia, as well as historically low inventories in the U.S., have left global supply levels depleted against elevated demand. The national average price of diesel registered sequential WoW increases throughout August, with fuel prices rising $0.348 during the month. The average price of diesel has now risen $0.726 in eight of the last nine weeks following the $0.017 increase recorded by the DOE/EIA on September 4. At present, diesel prices have hit their highest level since February 6, when prices registered $4.539 per gallon. Crude prices spiked in the early days of August with West Texas Intermediate (WTI) closing at $84.40, its highest level since November 16 of last year. After dropping below $80 per barrel for much of the back half of the month, WTI ended the month just over $83 per barrel and 6.6% below the same time last year. Despite the steady increase in prices, oil producers are continuing to favor shareholder returns over excessive supply growth, as the U.S. active drill rig count saw 13 more rigs go offline in the month of August, according to the recent Baker Hughes drill rig report.
Why it Matters:
Low stocks and no excess capacity have limited refining operations worldwide, causing many refiners to postpone maintenance and increasing the potential for technical problems that could send the global market into shock. In a recent announcement, Saudi Arabia has decided to extend its additional production cuts through the end of 2023, while Russian exports dropped to an 11-month low in August. Many anticipated another extension of the initial cuts that began in May, but the three-month sentence has shocked the market. Saudi Arabia and Russia both noted that further cuts were possible through the end of the year but would depend on the state of the market. The supply reduction by both countries has a particularly negative impact on diesel prices, as Russia is a major world supplier and Saudi-grade oil has an especially strong diesel yield when put through the refinery, according to a recent Wall Street Journal article. With supply levels showing no signs of growth in the near term, global energy prices are likely set to continue rising through the EOY. Rising energy prices will play a factor in the Fed’s battle against inflation, making the desired “soft landing” a little bumpier than expected. The White House has said it will do everything in its power to keep prices down, but current inventory levels and legislation have significantly reduced that power.
Dry Van Overview
Spot Rates
Key Points
- The national average dry van spot rate excl. fuel fell for the second month in a row, dropping 3.7%, or $0.06, MoM in August to $1.566.
- Dry van linehaul rates are 17.9% below 2022 levels and remain 16.7% below the 5-year average.
- The national average dry van contract rates excl. fuel also fell monthly in August, dropping 3.1%, or $0.066, to $2.045 and sitting 17.3% below the same month last year.
Load-to-Truck Ratio
Key Points
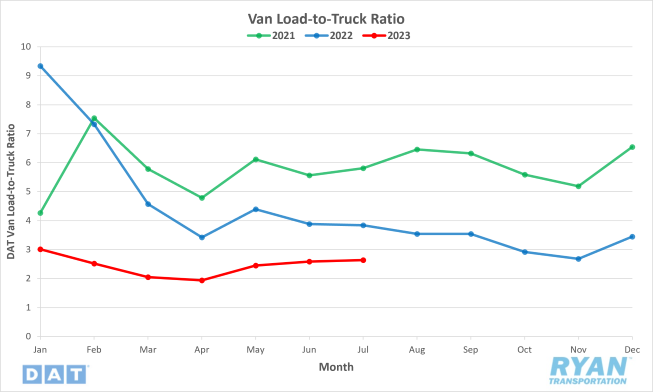
- The dry van load-to-truck ratio (LTR) increased 7.2% MoM in August but is 20.1% below 2022 levels.
Market Conditions
Dry Van Summary
Dry van activity saw a slight uptick in August, thanks to a boost in retail demand early in the month and at the end of the month from Labor Day and Hurricane Idalia making landfall during the same week. While the dry van LTR saw overall spot load volumes increase in August, it was not enough to create any upward pressure on spot rates until the last week of the month. The 7-day average linehaul rate for dry vans saw consistent WoW declines in the front half of August, dropping $0.05 through the first few weeks of the month. Responding to the weather and holiday disruptions in the final week, weekly dry van rates jumped back up $0.04 to end the month just $0.01 below where they had started. Through Hurricane Idalia had significantly less of an impact on freight markets as major storms in the past, the Southeast region that fell directly in the storm’s path saw the largest spike in WoW rates on outbound loads, with DAT reporting a $0.07 surge in dry van rates following the storm.
Reefer Overview
Spot Rates
Key Points
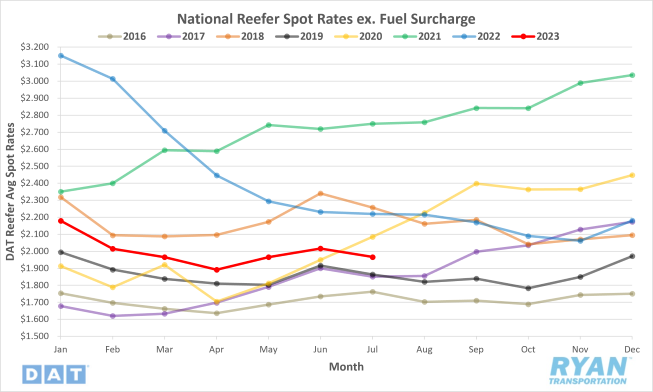
- The national average refrigerated spot rate excl. fuel declined 1.7%, or $0.034, MoM in August to $1.923.
- Reefer linehaul rates registered 13.2% below August 2022 and sit 11.5% below the 5-year average.
- National average reefer contract rates excl. fuel also fell in August, dropping 1.2%, or $0.029, MoM and remain 11.9% below contract rates in 2022.
Load-to-Truck Ratio
Key Points
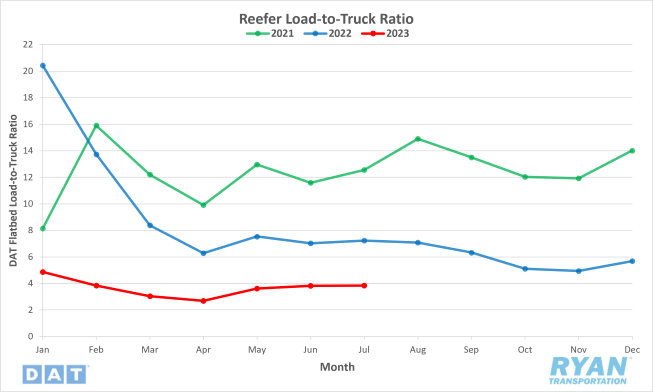
- The reefer LTR shot up in August, increasing by 14.5% MoM and putting it 37.7% below levels seen this time last year.
Market Conditions
Reefer Summary
The refrigerated sector outperformed typical seasonality in August and performed the best out of the three major modes, despite the bulk of annual volumes from southern produce now in the past. After an initial $0.02 drop in the first week, the 7-day average linehaul rate for reefer remained relatively flat through much of the month before spiking $0.05 in the last week of August. The roughly 15% increase in refrigerated spot volumes largely came in the last two weeks of August, as the reefer LTR jumped over 11% from $4.07 to $4.52 to close out the month. Much of the additional, unseasonable reefer volumes in the latter half of August came at the expense of the dry van sector. The heatwave, which blanketed the country with excess temperatures in the final days of the month, forced many customers to shift volumes away from dry van carriers in favor of temperature-controlled units to reduce the risk of product spoiling. August also marks the beginning of the apple harvest season out of the PNW, Michigan and the upper Northeast, as produce volumes continue their journey north. Apple harvest typically runs from August through November, with the 2023 apple yield projected to be 5% above the previous 6-year average, according to a report released by the Washington State Tree Fruit Association.
Flatbed Overview
Spot Rates
Key Points
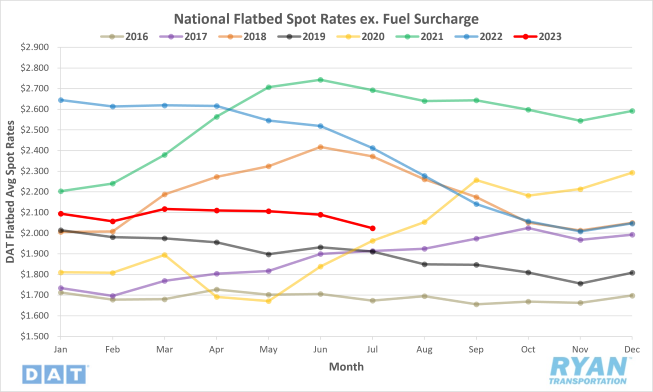
- The national average flatbed spot rate excl. fuel fell significantly in August, dropping 6.3%, or $0.127, MoM to $1.877.
- Flatbed linehaul rates remain 17.6% below 2022 rates and 13.4% below the 5-year average.
- National average flatbed contract rates fell by 5.1%, or $0.138, MoM and remain down 12.2% the same time in 2022.
Load-to-Truck Ratio
Key Points
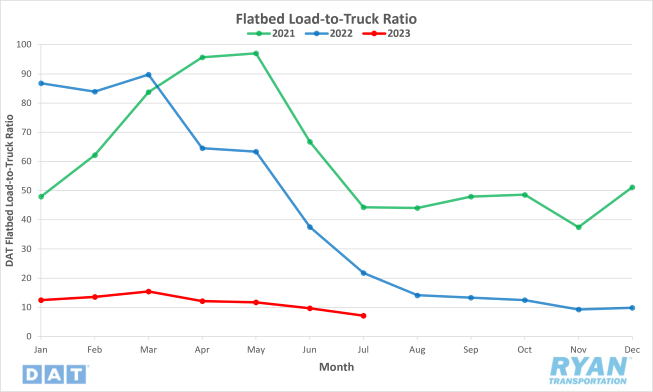
- The flatbed LTR decreased in August, dropping 15.1% from July’s average and sits 57.2% below levels in August of last year.
Market Conditions
Flatbed Summary
The flatbed sector continued its dismal performance through August, as spot market volumes and rates maintained their negative trend for 2023. Spot volumes registered 15.1% MoM below July and are down 57.2% from the same time in 2022. The 7-day average for flatbed linehaul rates fell $0.08 through the first two weeks of the month to their lowest level since the early days of the pandemic. Recovery and rebuilding efforts following Hurricane Idalia in the last week of August provided some relief for flatbed carriers, propping up spot market volumes by 8.6%, which translated to just a $0.02 uptick in WoW linehaul rates. Housing starts, a generally good indicator of future flatbed demand, were higher than many expected in July with total starts increasing 4% YoY. This was driven by notable gains in single-family construction, which saw a 6.7% increase YoY, according to the U.S. Census Bureau. The negative aspect of this gauge, however, is that housing starts are counted once ground is broken, even if the materials and equipment aren’t on site yet, which can skew the demand outlook more favorably.
Intermodal
Spot Rates
Key Points
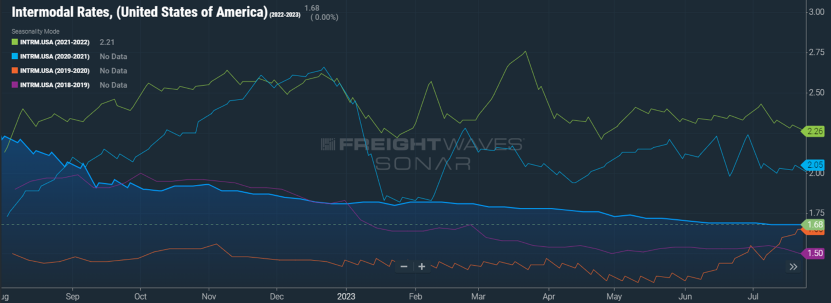
- The FreightWaves SONAR Intermodal Rates Index (INTRM.USA), which measures the average weekly all-in door-to-door intermodal spot rate for 53’ dry vans across a majority of origin-destination pairings, fell $0.03 in August to $1.66 and sits 18.6% below the same time in 2022.
- Compared to the 5-year average, intermodal rates in August were down 12.7%.
Volumes
Key Points
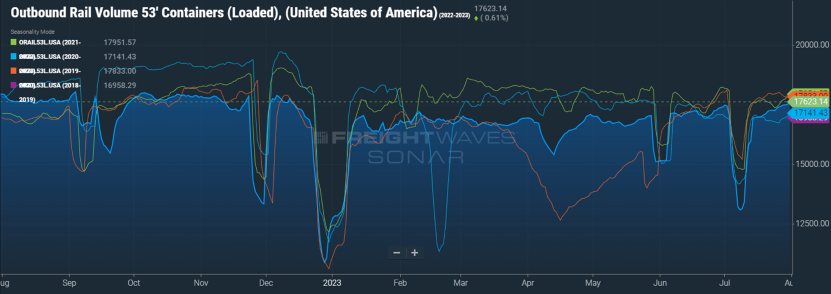
- Total loaded volumes for 53’ containers from all domestic markets, measured by the FreightWaves SONAR Loaded Outbound Rail Volume Index (ORAIL53L.USA), declined by just under 2.0% in August and 2.3% below August 2022 levels.
- Total loaded volumes registered 2.1% below the 5-year average for August.
Intermodal Summary
Carriers continued facing several headwinds, as conditions in the intermodal industry remained bleak with no real recovery in sight. Overall carload volumes, which historically begin to move higher in August, stayed relatively flat throughout the month as previous projections for another muted peak season come into fruition. Low import levels and increasing competition with the truckload industry remain the leading factors keeping volumes suppressed and driving rates down. The decline in intermodal rates in August saw the FreightWaves SONAR Intermodal Contract Savings Index (IMCSI1.USA), which measure the average percentage difference between all-in intermodal contract rates and all-in truckload rates in the same lane, increase 60 basis points to close out the month just over 9.0% in favor of intermodal carriers. While it’s a step in the right direction, the spread still remains less attractive to customers when compared to the faster and more direct truckload alternatives.
Further Reading
- Union Pacific furloughs workers due to lower volumes | FreightWaves
- Trucking Experts Prepare for Lackluster Peak Season | Transport Topics
- Preliminary Class 8 truck orders see solid August numbers | Logistics Management