Back to April 2025 Industry Update
April 2025 Industry Update: Dry Van
A slight increase in demand was not enough to stop further declines in rates.
Spot Rates
Key Points
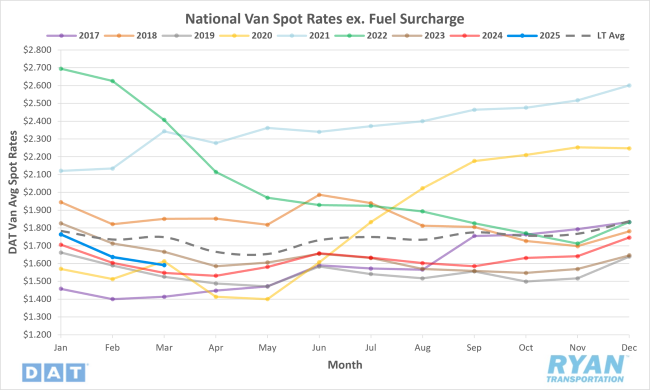
- The national average dry van rate exclusive of a fuel surcharge declined by 2.8% MoM (roughly $0.05) in March to $1.59.
- The average dry van spot linehaul rate was up 2.8% on an annual basis compared to March 2024 and 8.7% below the LT average.
- Initial reports show that average dry van rates excluding all surcharges were down 0.2% MoM in March but were 0.4% above the same month in 2024.
Load-to-Truck Ratio
Key Points
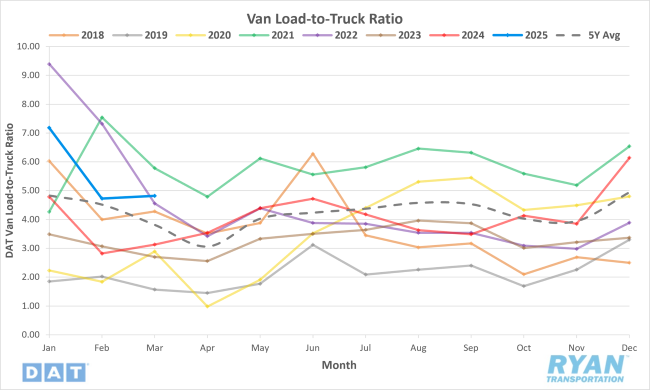
- The dry van load-to-truck ratio (LTR) rose 1.9% MoM in March to 4.82.
- Compared to March 2024, the dry van LTR was up 54.0% and 26.4% above the 5-year average.
- According to DAT load board data in March, dry van load posts were up 10.9% MoM compared to February, while equipment posts were up 8.8% MoM.
Market Conditions
Dry Van Summary
In January 2025, the ATA For-Hire Truck Tonnage Index showed a slight year-over-year gain of 0.3%, marking the first increase since August. Despite this modest uptick, overall freight demand remains soft due to ongoing weakness in the manufacturing and retail sectors. ATA’s Chief Economist Bob Costello emphasized that uncertainty surrounding the new administration’s policies, especially regarding trade, continues to cloud the economic outlook for truckload carriers. Shippers appear cautious, adopting a wait-and-see approach amid concerns of a prolonged trade war that could further suppress freight volumes in the first half of the year.
Operational costs remain a significant burden for carriers, with expenses running at about $0.18 per mile higher than pre-pandemic levels. Meanwhile, dry van linehaul rates are only marginally above 2019 levels, indicating that carriers are not seeing appropriate revenue gains. The freight environment in 2025 mirrors the downturn of 2019, when tariffs and weakened exports contributed to a freight recession. Many in the industry now expect 2026 to be the year of true recovery, after enduring yet another cycle of elevated costs and restrained demand in 2025.
International freight dynamics also reflect these challenges. While imports from China were up 12% year-over-year in February and well above long-term averages, they were down 12% month-over-month, indicating volatility. This translated into an additional 187,000 truckloads compared to historical February averages, helping offset some of the domestic freight softness. In contrast, trade with Canada has suffered dramatically following the implementation of new tariffs. In Toronto, dry van rates for outbound U.S.-bound freight dropped 10% week-over-week, and volume has halved in recent weeks.
Leading up to the tariffs on Canada and Mexico, cross-border dry van volumes surged as companies rushed to move goods before cost hikes took effect. This short-lived boost temporarily lifted rates and volumes—load volumes on the Toronto-to-Chicago route spiked 57% in one week. However, industry analysts expect this bump to fade quickly, with volumes and rates likely falling again as manufacturing uncertainty curbs demand. As Dean Croke from DAT notes, shippers’ urgency ahead of the tariff deadline may be followed by a demand lull, adding further strain to an already fragile trucking sector.