Back to April 2025 Industry Update
April 2025 Industry Update: Truckload Rates
Average rates in both the spot and contract markets changed little in March, keeping the contract-to-spot spread elevated above historic averages.
Spot Rates
Key Points
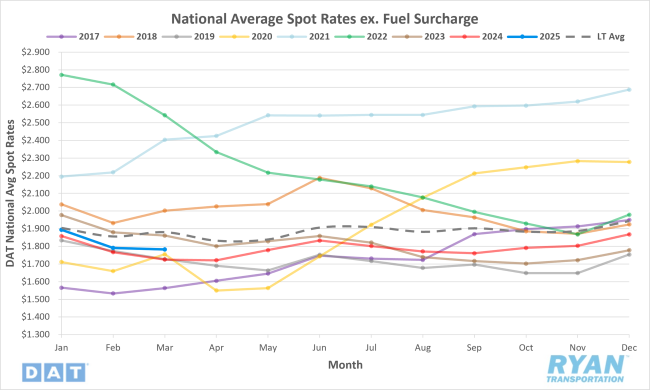
- The national average spot rate excluding fuel declined 0.4% MoM, or just under $0.01 per mile, in March to $1.78.
- Compared to March 2024, the national average spot linehaul rate was 3.4% higher YoY but remained below the long-term (LT) average by 5.5%.
Contract Rates
Key Points
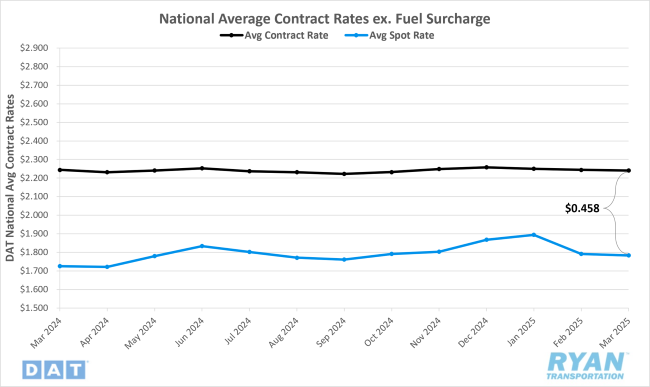
- Initially reported average contract rates excluding a fuel surcharge remained virtually flat MoM, decreasing by roughly 0.1% in March.
- On an annual basis, initially reported average contract linehaul rates were 0.1% lower YoY compared to March 2024.
- The contract-to-spot spread increased slightly in March, rising less than a penny from $0.453 in February to $0.458.
Summary
National average spot rates, excluding fuel surcharges, continued their downward trajectory in March for the second consecutive month, following a four-month period of consistent gains. Although the MoM decline in March was marginal relative to the sharper correction experienced in February, it still deviated from historical seasonal norms. Specifically, the $0.01 MoM decrease fell short of the typical seasonal increase of $0.02 observed for March. When excluding post-COVID market distortions, the pre-pandemic seasonal average for March rises to slightly over $0.03. Notably, prior to the current freight market downturn that began in 2022, average spot linehaul rates in March had only declined twice in the past decade—during the industry recessions of 2016 and 2019.
The modest MoM decline in March was largely a reflection of the relative stability in weekly pricing trends, as indicated by the DAT 7-Day Average Spot Linehaul Rate Index. Following a pattern of gradual decreases throughout February, consistent with seasonal expectations, average spot rates remained confined within a narrow range of approximately $0.004 throughout March. The index began the month with a slight WoW increase of just under $0.01 relative to the final week of February; however, those gains were effectively neutralized by a comparable WoW decline in the second week. Rates then trended sideways for the remainder of the month.
On the contract side of the market, initial readings of average contract rates, excluding fuel, remained largely flat on a MoM basis. Since December 2023, changes in average contract linehaul rates have fluctuated within a tight 0.1% range each month. From a YoY perspective, the gap has also continued to narrow, improving from 0.9% below YoY in January to just 0.1% below in March.
With minimal rate movement in both the spot and contract segments, the contract-to-spot spread remained largely unchanged in March. The spread increased marginally, by only a fraction of a cent, and continues to hover slightly above the pre-pandemic historical average range of $0.35 to $0.45.
Why It Matters:
Despite widespread volatility across the transportation sector in March, average spot rates remained relatively flat, a development that appears counterintuitive given the typically responsive nature of the spot market. Historically, spot rates tend to rebound in March as seasonal demand pressures begin to pick up, pulling rates up from their early-year lows. However, an ongoing imbalance between supply and demand has rendered this seasonal trend largely obsolete over the past three years, with March continuing to post rate declines each year. Notably, the marginal MoM decline in March 2025 was significantly less pronounced than in previous years, prompting some analysts to view it as a potential early indicator of a spring demand uptick as market conditions move closer to equilibrium. Still, inconsistent demand trends and uneven rate performance across transportation modes suggest that pre-tariff pull-forward activity likely played a more influential role in shaping March’s data.
The timeline for a recovery in truckload pricing remains uncertain, largely due to the outsized impact of external disruptions over the past quarter, which have overshadowed changes in fundamental supply and demand dynamics. This uncertainty was underscored by the March 2025 Logistics Managers’ Index® (LMI®), which reported a sharp 9.0% MoM decline in its Transportation Prices Index—from 65.4% in February to 56.4%—marking the lowest reading since April 2024. This drop represents the largest single-month decline since July 2022, which signaled the onset of the 18-month freight recession.
The report highlights that most of March's decline occurred in the latter half of the month, with the index falling from 60.5% in early March to 51.1% in the second half. This sharp decline pushed the Transportation Prices Index below the Transportation Capacity Index for late March, creating a negative freight inversion—when capacity grows faster than pricing—a signal historically associated with market downturns. The last occurrence of such an inversion was in April 2024, marking the 21st of 22 months during which capacity exceeded pricing before the trend briefly reversed in May 2024. While the report cautions that this inversion may be temporary and would require sustained trends to be officially labeled a freight recession, it warrants closer observation in the coming months.
With the most recent bid cycle concluded, routing guides and new annual contract rates are set to roll out across much of the industry in April and May. Despite a slight improvement in carriers' negotiating position compared to the past two years, shippers continue to maintain the majority of pricing leverage, especially with limited upward pressure from spot rates. In a climate of renewed recessionary concerns and ongoing economic uncertainty, cost containment remains the predominant priority for shippers—more so than in previous years. This focus on savings, combined with increased confidence in rail as a competitive alternative, limits the potential for near-term contract rate increases.
According to its latest quarterly release, the TD Cowen/AFS Freight Index, rates declined 1.5% QoQ in Q1 2025, marking the ninth consecutive quarterly decrease. Nevertheless, the index remains 5.9% above its January 2018 baseline and exceeded expectations. The report projects a further 0.4% QoQ decline in Q2 2025, citing challenging macroeconomic conditions and evolving trade policy as key headwinds to growth.
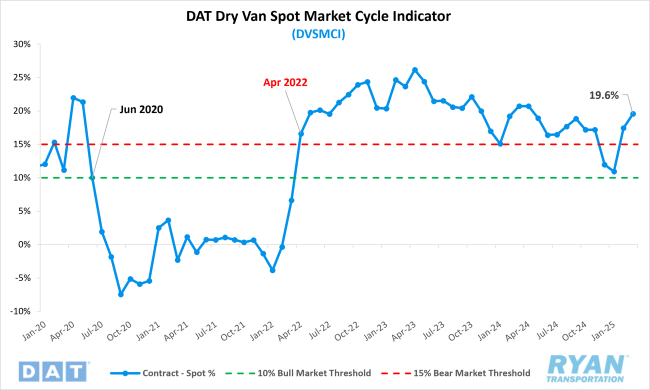
Meanwhile, the Dry Van Spot Market Cycle Indicator (DVSMCI), which measures the spread between spot and contract rates relative to historical averages, increased by 2.2% MoM in March, reaching 19.6%, further entrenching the market in bearish territory. According to Jason Miller, Eli Broad Endowed Professor of Supply Chain Management at Michigan State University and the creator of the index, readings above 15% signify bearish market conditions, while levels below 10% indicate a bullish environment.