Back to April 2025 Industry Update
April 2025 Industry Update: Truckload Supply
Capacity exits continued to create tighter market conditions compared to years past, but tender rejections still indicate ample supply levels.
Key Points
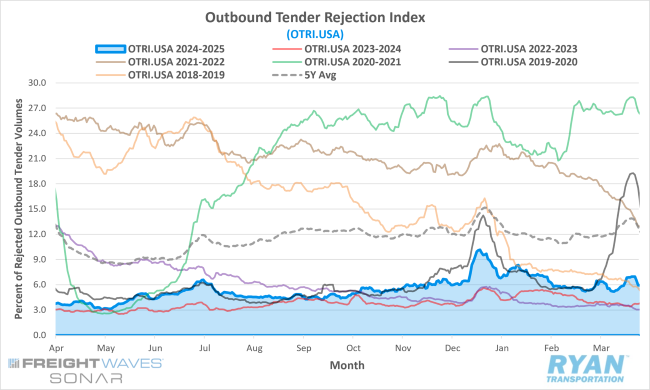
- The FreightWaves SONAR Outbound Tender Rejection Index (OTRI.USA), a measure of relative capacity based on carriers’ willingness to accept freight volumes under contract reflected as a percentage, registered 54 basis points (bps) higher at the end of March compared to levels at the start of the month, rising from 5.40% at the beginning of the month to 5.94% by the end.
- The monthly average of daily tender rejections in March rose 24 bps MoM compared to February, rising from 5.79% to 6.03%.
- On an annual basis, average daily tender rejections were up 2.29% YoY compared to March 2024 but were 6.56% below the 5-year average.
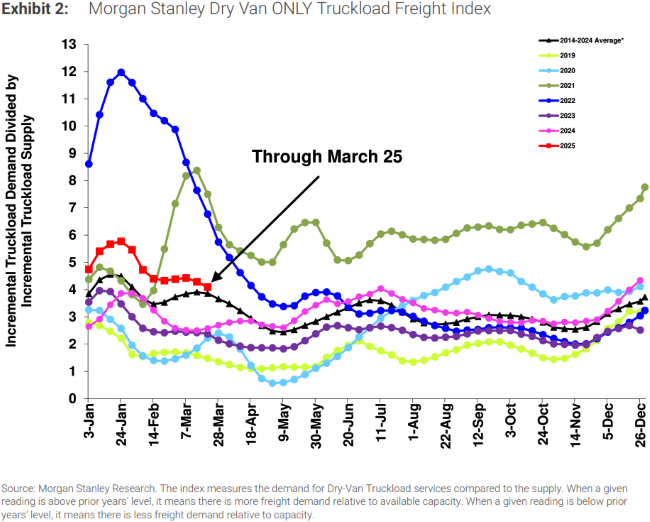
- After a slight increase in the second half of February, the Morgan Stanley Truckload Freight Index (MSTLFI) registered consecutive declines throughout March and continued to underperform typical seasonality driven by further strong underperformance in the demand component.
Summary
In contrast to the relative stagnation observed in freight volumes during March, tender rejection rates, as tracked by FreightWaves SONAR, exhibited considerable volatility throughout the month—largely driven by market uncertainty surrounding potential tariff implementations.
After stabilizing in February and trending downward due to seasonal pressures, rejection rates surged sharply during the first week of March. Midway through the week, the index rose by 128 bps WoW, reaching 6.48%. This early spike was followed by a period of moderation in the second week. However, by the start of the third week, rejection rates registered a sharp decline, falling 118 bps WoW to 5.18%, the lowest level recorded since late October 2024. In the final week of the month, rejection rates rebounded just as abruptly, climbing 153 bps WoW at the start of the week and adding another 12 bps in the following days to peak at 6.97%. The month concluded with a decline of 103 bps in the last two days, ending March at 5.94%.
The consistent YoY and QoQ growth in rejection rates—despite declining tender volumes—indicates that the contraction in carrier capacity over the past year has had a more pronounced effect on market dynamics than the reduction in freight volumes. March marked the 15th consecutive month of YoY increases in tender rejections. Furthermore, quarterly rejection averages have risen for the past three consecutive quarters. At 6.41%, the Q1 average was the highest since Q1 2022 (9.23%), which marked the beginning of the current freight downcycle.
According to Morgan Stanley’s latest Truckload Freight Index report, the market continued to underperform relative to seasonal norms, primarily due to softer-than-expected demand and restrained growth in available capacity. The report highlighted a 180-bps decline in demand during March, which stands in stark contrast to the historical seasonal increase of 1,200 bps typically observed during the month. On the supply side, capacity rose by 440 bps, compared to a seasonal average of 810 bps. Notably, the latter half of March marked the first instance of supply underperformance since mid-January.
Forward-looking sentiment across the three major index components—Truckload Demand, Truckload Supply and Truckload Rates—turned decisively negative in March. Survey participants cited macroeconomic uncertainty, persistent market softness and a surplus of capacity as primary headwinds suppressing rate growth and dampening confidence in both short-term and long-term outlooks.
Why It Matters:
Following a period of relative stability in February, the significant volatility in tender rejection rates observed throughout March indicates that continued reductions in available capacity have heightened the market’s susceptibility to external disruptions, despite an ongoing imbalance in supply. However, the sharp movements in the OTRI last month were largely attributable to fluctuations within the flatbed segment.
According to the FreightWaves SONAR Flatbed Outbound Tender Rejection Index (FOTRI.USA), flatbed rejections increased by 22.4% MoM at the end of March compared to February’s close. In contrast, dry van rejections rose by only 0.52% MoM while reefer rejections increased by a modest 0.60% during the same period. Given that key indicators in the housing and industrial sectors did not exhibit corresponding growth, the surge in flatbed rejections appears to stem primarily from preemptive inventory movements—particularly bulky goods and industrial commodities such as lumber from Canada, as well as steel and aluminum imports—likely in anticipation of pending tariff implementations.
While the uncertainty surrounding trade policy continues to present substantial headwinds for a sustained demand recovery, there may be a potential upside for the for-hire segment. According to the February 2025 Cass Transportation Index Report, heightened ambiguity across both trade and regulatory policy landscapes could slow the recent expansion of private fleets, a trend that has contributed to the erosion of for-hire market share.
Specifically, the report highlights that the U.S. Environmental Protection Agency’s (EPA) proposed low-NOx emissions standards, set to take effect in 2027, have prompted a wave of pre-buying among private fleets in recent years. However, with these regulations now under review, that pre-buying momentum is expected to subside or even reverse, which wouldlimit future equipment additions. This anticipated slowdown, combined with the potential implementation of tariffs that could increase the cost of Class 8 trucks by approximately $20,000 per unit, may trigger a supply shock later in the year. Such a move would further tighten the equipment market and potentially support rate stabilization.