Back to February 2025 Industry Update
February 2025 Industry Update: Dry Van
Weather disruptions forced rates higher while dry van volumes lacked similar gains observed across the other major modes.
Spot Rates
Key Points
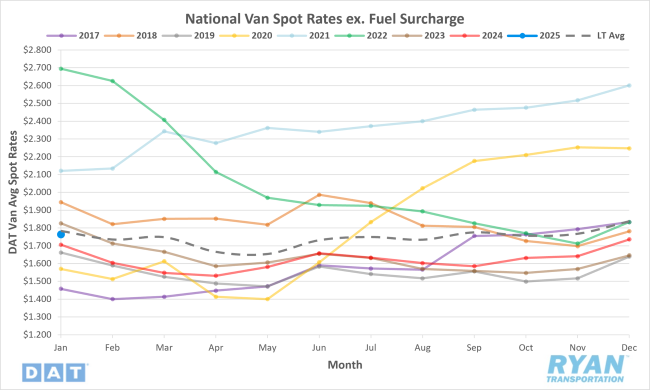
- The national average dry van rate exclusive of a fuel surcharge rose 1.6% MoM, or just under $0.03, in January to $1.76.
- The average dry van spot linehaul rate was up 3.3% on an annual basis compared to January 2024 and 2.7% below the LT average.
- Initially reported average dry van rates excluding all surcharges were virtually flat compared to both December and the same month in 2024, rising by less than a penny, or 0.3% MoM, and registering 0.1% lower on an annual basis.
Load-to-Truck Ratio
Key Points
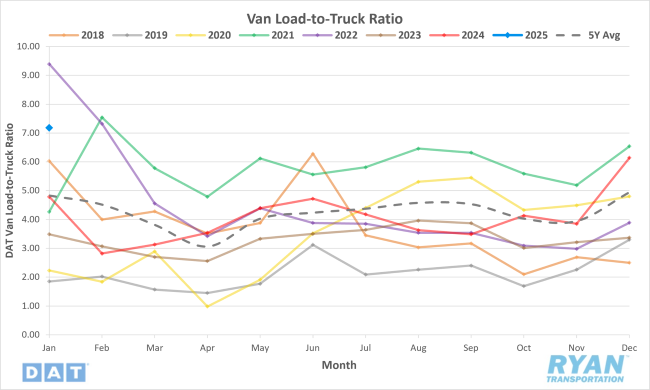
- The dry van load-to-truck ratio (LTR) increased by 16.9% MoM in January to 7.18.
- Compared to January 2024, the dry van LTR was up 49.9% YoY and 48.5% above the 5-year average.
- According to DAT load board data in January, the uptick in the dry van LTR was driven entirely by a near 17% increase MoM in load posts while truck posts were flat MoM.
Market Conditions
Dry Van Summary
The dry van sector continues to experience shifts in market conditions, driven by seasonal influences, regulatory impacts and capacity adjustments. Spot rate increases were fueled by winter weather events like Winter Storm Blair and pre-tariff inventory adjustments. The sharp increase in dry van LTR indicated tightening capacity driven by temporary disruptions and increased load postings with little to no increases in equipment postings. Contract rates for dry van freight have been increasing, and January marketed the third consecutive month of YoY gains following prolonged declines. A gap between spot and contract rates persists, upward pressure on contract pricing is supported by higher private fleet costs and sustained demand for consistent capacity. Continued rate increases are anticipated as capacity dynamics shift toward tighter conditions in 2025. According to Tim Denoyer, VP and Sr. Analyst at ACT Research, “In early January, rate trends were about $0.03 above normal seasonal patterns. With the market near balance and demand supported by pre-tariff shipping and weather disruptions, spot demand and rates are expected to remain elevated above seasonality in Q1.”
FreightWaves Sonar VOTRI measuring van-specific tender rejections approached 9% around Christmas. It settled just below 8% by year-end 2024 but spiked again in early January amid the disruptive Winter Storms Blair and Cora wreaking havoc in the Midwest and Southeast regions. Van rejection rates are ahead of what they were around the 2024 summer peak and well above the highest level in 2023, confirming routing guide’s increasing sensitivity to disruption. Though demand was down overall, much of the contract volume likely just shifted to the spot market. Whether these conditions hold remains to be seen. A return to semi-predictable seasonal patterns comes the seasonal decline in spot and outbound tender rejection rates, as late January through February is a slower period in the dry van space. Tariffs remain a wild card and the winner of a glut of imports is a toss-up between full truckload and intermodal, which increased its share at the expense of truckload in long-haul corridors like Los Angeles outbound.