Back to February 2025 Industry Update
February 2025 Industry Update: Flatbed
Despite minimal growth in overall volumes, flatbed demand surged as cold weather limited outdoor loadings.
Spot Rates
Key Points
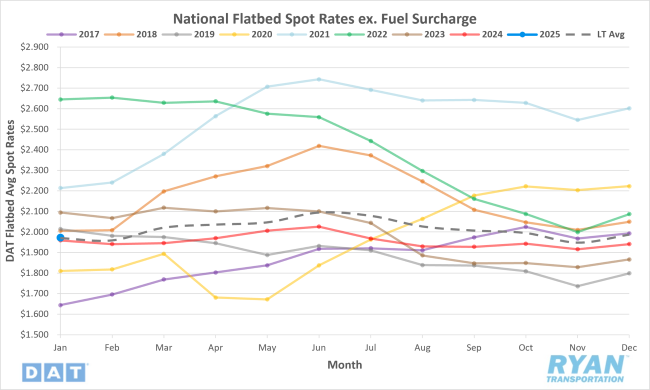
- The national average flatbed spot rate excluding a fuel surcharge increased 1.6% MoM, or $0.03, in January to $1.97.
- Average flatbed spot linehaul rates in January were up 0.7% YoY compared to January 2024 but remained below the LT average by 1.1%.
- The initially reported flatbed contract rate excluding any surcharges declined 1.1% MoM in January but was up 1.3% compared to January 2024 levels.
Load-to-Truck Ratio
Key Points
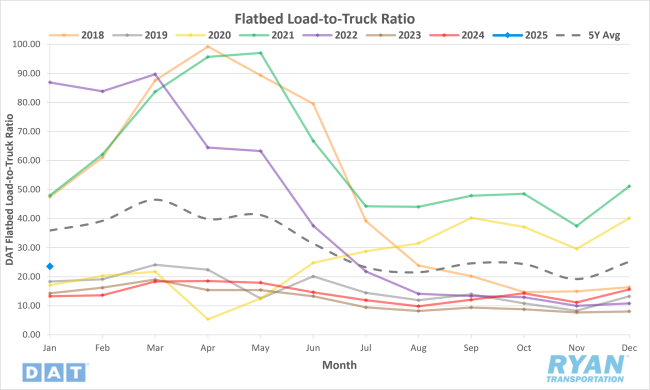
- The flatbed LTR registered a 50.3% MoM increase in January to 23.56.
- Compared to January 2024, the flatbed LTR was 77% higher YoY but registered 34.4% lower than the 5-year average.
- Flatbed load post volumes on the DAT load board were up 45.9% MoM, while equipment posts were down 2.9% MoM in January.
Market Conditions
Flatbed Summary
For flatbed carriers looking for demand signals in 2025, Redfin predicts fewer construction regulations will lead to more homebuilding. Redfin’s economists expect more home sales in 2025, largely due to pent-up demand. However, some would-be homebuyers will still be priced out, with home prices climbing and mortgage rates near 7%. Redfin expects homebuilders to construct more single-family homes in 2025, though it will take a few years for the volume increase to make buying a house significantly more affordable. Builders will also bank on the fact that mortgage-rate lock-in effect will limit the amount of existing inventory competing with new builds.
According to the Commerce Department, U.S. single-family homebuilding hit a 10-month high in December, signaling improved housing activity. However, rising mortgage rates and oversupply of new properties may limit recovery. Permits for future single-family home construction rose 1.6% MoM, reaching its highest level since February 2024. Housing starts increased by 3.3% to an annual rate of 1.05 million units, also the highest since February 2024. Notable increases included 14.3% in the Northeast, 8.3% in the Midwest and 7.1% in the West.
As one of the world’s top five producers of crude steel, as of November 2024, the U.S. steel industry produced over 74 million net tons of steel annually. In the week ending January 4, 2025, the U.S. produced 1.635 million net tons of raw steel, a 1.3% decrease from the same period in 2024 and 7% lower than the 5-year average. In Indiana, where most raw steel is manufactured, production volumes were down almost 7% in November adding to the lackluster demand being experienced by flatbed carriers. According to data from S&P Platts, U.S. steel production the week ending January 4, 2025 was down in every steel-producing region in the country led by the Northeast down 4.9% MoM, Great Lakes down 4% MoM and West down 3.4% MoM.