Back to February 2025 Industry Update
February 2025 Industry Update: Truckload Capacity Outlook
Capacity exits continued to slow as market conditions become more stable.
Key Points
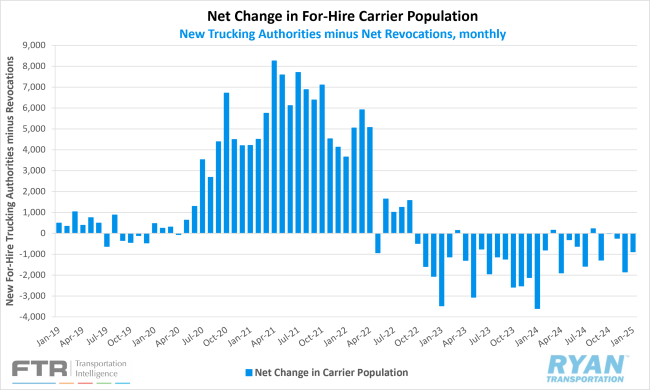
- Total net revocations, a measure of total authority rejections minus reinstatements, fell by 920 carriers last month, dropping from 5,565 total revocations in December to 4,645 in January, according to FTR’s preliminary analysis of the Federal Motor Carrier Safety Administration’s (FMCSA) data.
- The number of newly authorized for-hire trucking companies rose slightly in January by 43 carriers, increasing from 3,716 in December to 3,759 in January.
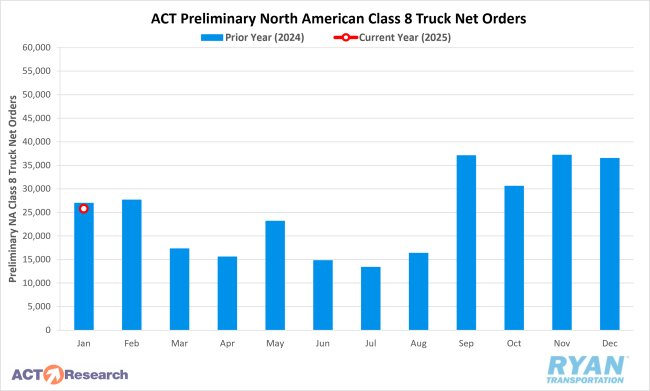
- Preliminary North American Class 8 Order estimates ranged from 24,000 units as reported by FTR to 25,800 units per ACT Research, with both estimates reporting lower YoY by 15% and 5%, respectively.
Summary
Since reaching an all-time high in January 2024, net declines in the carrier population have shown signs of steadying, with last month’s figure decreasing by over 2,700 compared to the same period in the previous year. Following a surge in capacity exits in December, the net decrease in for-hire trucking companies declined by more than half MoM in January, totaling 886 carriers. While this decline remained higher than most months in 2024, it was still well below the average monthly decrease of 1,755 carriers recorded in 2023.
The slowdown in active carrier authority revocations can largely be attributed to a moderation in the rate of both new entries and exits. In January, this trend reversed from December, with the number of newly authorized carriers increasing by 43, while net revocations dropped by over 900. The 3,749 new for-hire carriers registered in January represented the third-lowest monthly figure processed by the FMCSA since before the pandemic, trailing only December 2024 (3,716) and December 2023 (3,741). Similarly, net revocations in January fell to their lowest level since April 2022, with the exception of November 2024.
On the equipment side, preliminary estimates for North American Class 8 truck orders declined on both a monthly and annual basis, though industry sentiment remained mixed. According to FTR, net orders in January were 28% lower MoM compared to December and fell short of seasonal expectations, registering well below the seven-year average of 27,950 units for the month. FTR also noted that while cumulative net orders for the 2025 order season (spanning September 2024 through January 2025) reflected a 3% YoY increase, momentum likely slowed due to trade tensions among North American partners and growing uncertainty in the freight market. Conversely, ACT Research reported that despite a 30% MoM decline in January, Class 8 order activity remained relatively strong. ACT highlighted that while January orders were slightly lower than the previous year’s levels, they were also competing with seasonally higher order activity in December. After adjusting for seasonality, January orders fell 22% MoM to 23,300 units.
Why It Matters:
The sustained slowdown in capacity exits that began early last year strongly indicates that market conditions are stabilizing. While the number of operating authorities remains elevated compared to pre-pandemic levels, the gradual improvement in truckload conditions has led to a decline in market exits, particularly among smaller carriers. According to FMCSA data, total carrier exits decreased by approximately 50% YoY between 2023 and 2024, falling from 40,000 to around 19,000. Given the current trajectory, some analysts speculate that capacity levels could begin expanding again in 2025. However, any potential increases are expected to be more measured and controlled, in contrast to the surge witnessed in 2021.
Although changes in operating authorities provide insight into shifting capacity levels, they offer only a partial perspective on overall supply trends. According to the latest Bureau of Labor Statistics (BLS) report, truck transportation employment increased by 3,800 jobs in January, with a total of 7,400 jobs added over the past three months. However, annual revisions to benchmark data revealed significantly lower employment levels than previously reported, with December figures reflecting 27,800 fewer jobs than initial estimates. This downward revision places current truckload employment just 0.3% above the pre-pandemic level of February 2020, compared to the previously reported 1.7% increase.
While an expansion in capacity this year appears premature given the limited overall improvement in market conditions, ongoing trade negotiations between the U.S. and its three largest trading partners could significantly impact this outlook. The potential imposition of 25% tariffs on Canada and Mexico, currently paused until early March, was a key factor in the softening of equipment demand in January. According to FTR, 40% of U.S. Class 8 trucks are manufactured in Mexico, while 65% of Canada’s Class 8 trucks are produced in the U.S. The report suggests that tariffs, along with potential retaliatory measures, would likely exacerbate demand pressures. The American Trucking Association (ATA) has estimated that a 25% tariff on Mexico could increase the price of new tractors by as much as $35,000.