Back to February 2025 Industry Update
February 2025 Industry Update: Truckload Rates
Capacity disruptions from the holidays led to both spot and contract rates trending higher in December.
Spot Rates
Key Points
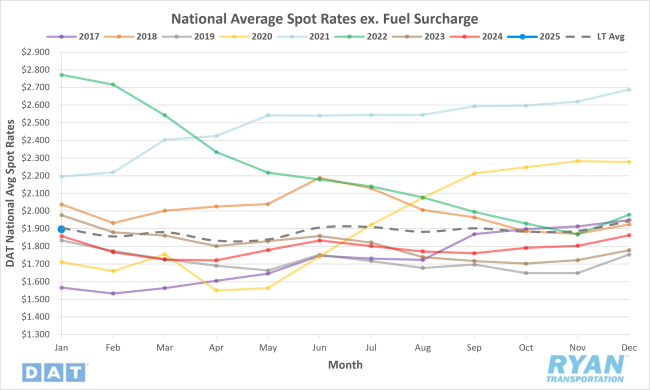
- The national average spot rate excluding fuel increased 1.8% MoM, or $0.03, in January to just under $1.90.
- Compared to January 2024, average spot linehaul rates were 2.1% higher YoY and 1.8% below the long-term (LT) average.
Contract Rates
Key Points
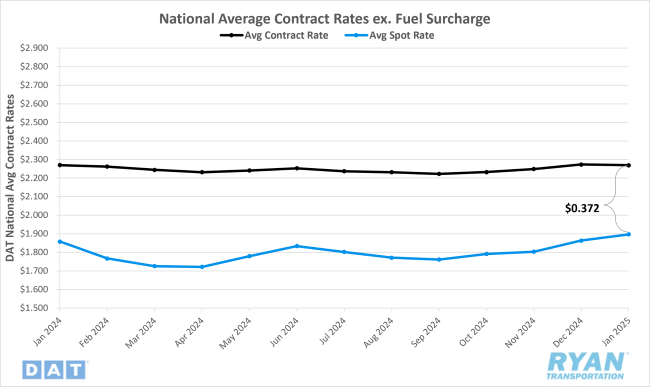
- Initially reported average contract rates excluding a fuel surcharge were virtually unchanged in January, falling by 0.2% MoM, or by less than a penny.
- On an annual basis, initially reported average contract linehaul rates were flat YoY compared to January 2024.
- The contract-to-spot spread declined by just under $0.04 MoM, dropping from $0.41 in December to just over $0.37 in January.
Summary
National average spot rates, excluding fuel, continued their upward trajectory for the fourth consecutive month in January, reaching their highest level in two years and exceeding typical seasonal trends for the period. At just under $1.90 per mile, the national average DAT linehaul spot rate for January marked its highest point since January 2023, when the average rate stood at just under $1.98, or $0.08 higher. From a seasonality perspective, January’s 1.8% MoM increase outperformed the historical average decline of 0.7% for the month. Notably, when excluding post-pandemic years, last month’s gains appear even more significant, as the typical seasonal decline for January deepens to 1.9%.
A more granular look at the monthly rate movements reveals that January’s MoM increase was likely primarily driven by lingering elevated holiday pricing amidst prolonged capacity disruptions. The DAT 7-day Linehaul Spot Rate Index, which tracks weekly fluctuations in average spot linehaul rates, indicates that average linehaul spot rates rose by just over $0.03 WoW in the first full week of the month. This increase was largely attributable to winter weather disruptions, which delayed drivers’ return to the road following their typical extended holiday break. However, following this initial surge, the rolling average recorded consistent declines throughout the remainder of January, ultimately decreasing by 5.5%, or just under $0.11. The decline was relatively evenly distributed, with the second full week nearly offsetting the prior week’s gains before accelerating slightly through month-end.
Meanwhile, average linehaul contract rates remained slightly lower but were largely stable on a MoM basis in January, as the 2025 RFP bid cycle continued. Contract rates have been operating within a narrow range, with the average monthly rate of change registering just 0.02% since January 2024, when this flattening trend began. Previously, between the onset of the current downturn in March 2022 and December 2023, contract linehaul rates declined by an average of approximately $0.03 per month, amounting to a total decrease of just over $0.50 during that period. This notable shift suggests that after initially shortening contract timelines through monthly and quarterly bid cycles as well as employing “mini bids” during the early phases of the downturn, shippers have made a full return to annual contracts to lock in low rates as the availability of further rate concessions have diminished.
Why It Matters:
January brought several positive developments in truckload pricing, though the market remains far from a neutral balance of pricing power.
Historically, spot rate increases in January are uncommon, having occurred just four times in the past decade. However, those rate gains have almost become commonplace as three of those occurrences have come in the last four years – 2022, 2024 and now 2025. Unlike 2022 and 2024, whose leading factor for the MoM increases are easier to pinpoint, the primary driver of January’s rate increase is less clear. Initial speculation suggests that ongoing capacity reductions have heightened the market’s sensitivity to seasonal disruptions, as evidenced by four consecutive months of rising spot rates. Notably, the four-month stretch of average spot rate gains marks the longest streak since the five-month climb leading to the current cycle peak between September 2021 and January 2022.
Further support for a strengthening pricing environment for carriers comes from the January 2025 Logistics Managers’ Index (LMI) Report, which recorded a 3.5% MoM increase in the Transportation Prices Index to 70.4%, its highest level since April 2022. The report highlights that rising transportation prices, despite declining diesel costs, indicate demand-driven growth rather than inflationary pressures.
While market fundamentals suggest a shift toward equilibrium, the role of early January winter storms – similar to those in 2024 – cannot be overlooked. Although less severe than the prior year, these disruptions occurred at a critical time when drivers typically return to the road following the holidays. This is evident from the DAT 7-day Linehaul Spot Rate Index historically registering its largest WoW declines for the month during the second and third week, which has not been the case over the last two years.
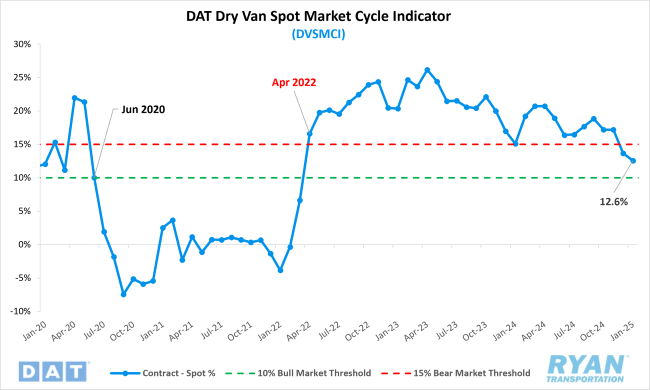
Despite the primary cause, the continued upward trajectory in spot rates while contract rates remain flat further narrowed the gap between the two, dropping the contract-to-spot rate spread to $0.37—the lowest since March 2022, when it stood at $0.19. Additionally, the DAT Dry Van Spot Market Cycle Indicator (DVSCMI), which measures the ratio between spot and contract rates, also fell to its lowest level since March 2022, dropping 1.1% MoM from 13.7% in December to 12.6% in January. According to Jason Miller, Interim Chair of the Department of Supply Chain Management at Michigan State University, a ratio above 15% signals a bearish market, while a ratio below 10% suggests a bullish shift. Although January’s figure remains slightly above this threshold, the continued downward trend suggests a market turnaround could be imminent.