Back to March 2025 Industry Update
March 2025 Industry Update: Fuel
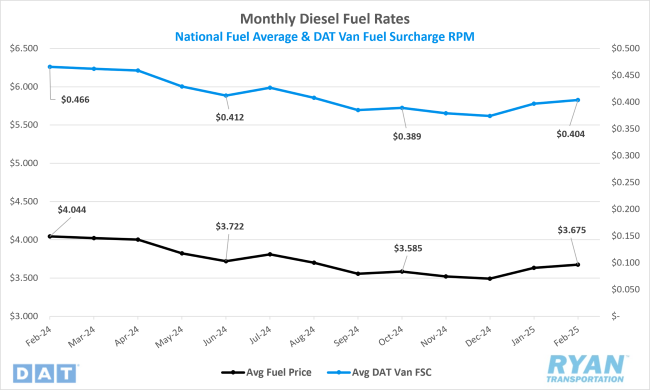
Average fuel prices registered moderate increases in February as markets stalled amidst policy uncertainty.
Key Points
- The national average price of diesel increased in February, rising 1.1% MoM, or $0.041, to $3.675.
- Compared to February 2024, diesel prices were down 9.1% YoY, or nearly $0.37, in February.
- Builds on U.S. Commercial Crude inventories outpaced draws in February by 2.5M barrels (bbls) and outperformed the consensus of 2.0M bbls for the weeks ending February 7 and February 28.
Summary
Following declines in nine of the twelve months of 2024, national average fuel prices have begun to trend upward in early 2025. February’s MoM increase of $0.04 marked the second consecutive month of gains and the first instance in 17 months where average fuel prices rose in back-to-back months. After reaching their lowest level since September 2021 in December 2024, the benchmark diesel price has increased by more than $0.18 in 2025, reaching a five-month high while remaining well below February 2024 levels.
Consistent with January, the rise in average fuel prices in February was driven by steady, albeit modest, WoW increases throughout the month. Despite market volatility spurred by the looming trade war, diesel futures on the CME commodity exchange remained within a relatively narrow range, contributing to overall price stability at the pump. According to weekly data from the Energy Information Administration (EIA), weekly fluctuations averaged just $0.01 WoW, with diesel prices increasing by a total of just under $0.02 in the first three weeks before recording their largest WoW gain of $0.02 in the final week. By the end of the month, diesel prices had risen in seven of the first eight weeks of the year, standing more than $0.22 above the $3.48 benchmark recorded ahead of Christmas.
Despite the recent increase in fuel prices, commercial crude inventories continued to build at a faster pace than drawdowns for the second consecutive month. Much of this inventory accumulation can be attributed to production disruptions caused by “freeze-offs” as severe winter weather impacted operations nationwide, leading to a significant decline in refinery utilization. This, combined with lower seasonal demand, prompted many producers to initiate refinery maintenance activities earlier than usual, ahead of the typical late February to mid-March peak maintenance period.
Additionally, a key factor in the rise of commercial crude inventories – particularly at the crucial Cushing, Oklahoma storage hub – was a surge in Canadian oil imports following the Trump administration’s announcement of a 10% tariff on Canadian crude, set to take effect on March 4th. In the week following the announcement, imports from Canada rose by 165,000 barrels per day (bpd) to 3.8M bpd, though still below the record 4.4M bpd recorded in January when initial tariffs were expected to be implemented.
Why It Matters:
The relative stability of oil markets in February provided a welcome reprieve amid the volatility observed across other industries. While not ideal, the modest MoM increase in average fuel prices – particularly when compared to the more significant price surges in other commodities – offered some relief to carriers contending with sharp declines in truckload rates. However, recent reports indicate that the constrained trading range in the futures market, which has contributed to limited price fluctuations at the pump, stems from uncertainty within the oil sector due to the influx of new policies and regulatory changes. According to a recent Bloomberg report, the rapid pace of new information, coupled with the realization that a single social media post can significantly impact market movements, has led many traders to scale back their exposure.
While average fuel prices remain subdued compared to the levels seen in the three years following Russia’s invasion of Ukraine, the potential ramifications of a trade war with the United States’ largest trading partners could drive prices higher. The latest monthly report from the EIA, which reflects data with a two-month delay, indicates that of the approximately 6.6M bpd in total U.S. crude imports recorded in December, Canada accounted for over 4.2M bpd – or roughly 65% – while Mexico was the second-largest exporter, supplying 415,000 bpd (just over 6%). While energy imports from both countries would be subject to tariffs, the primary focus is expected to be on Canadian imports due to existing infrastructure constraints. Unlike Mexico, which primarily transports crude exports via maritime routes, a significant portion of Canadian crude is delivered to the U.S. through pipeline networks, limiting its ability to be easily redirected to alternative markets.
A recent analysis by the Energy Policy Research Foundation (EPRINC) estimates that, based on the benchmark crude price per barrel from each country, the total implied value of crude oil imports from Canada and Mexico in 2024 was $104 billion ($92 billion from Canada and $12 billion from Mexico), accounting for approximately 12% of the $900 billion in total U.S. imports from both nations. Furthermore, Canadian and Mexican crude supplies constitute 30% of total U.S. crude oil consumption. Applying the tariff rates outlined in President Trump’s executive orders, the estimated annual increase in the cost of imports from these two countries would amount to $10.9 billion, or 2.9%. According to EPRINC’s analysis, “since crude costs are passed on to product prices, this would imply, in the aggregate, an increase of $0.09 per gallon using the current U.S. national average of $3 per gallon for regular gasoline.” While the report did not specify an equivalent figure for diesel, it is widely assumed that the impact would exceed $0.09 per gallon.