Back to March 2025 Industry Update
March 2025 Industry Update: Truckload Rates
Average spot rates declined sharply while average contract rates remained unchanged.
Spot Rates
Key Points
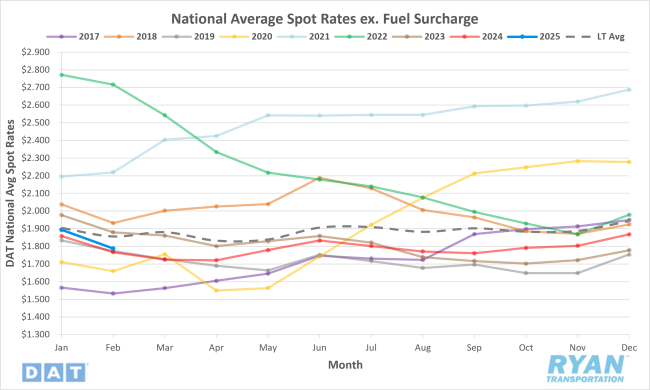
- The national average spot rate excluding fuel fell 5.6% MoM, or $0.11, in February to just under $1.79.
- Compared to February 2024, average spot linehaul rates were 1.2% higher YoY and 4.6% below the long-term (LT) average.
Contract Rates
Key Points
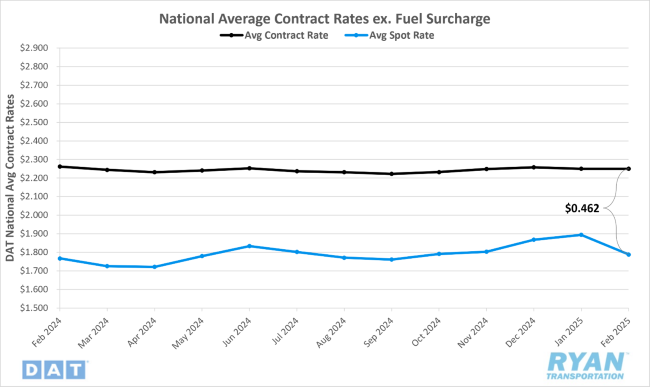
- Initially reported average contract rates excluding a fuel surcharge were unchanged MoM in February.
- On an annual basis, initially reported average contract linehaul rates were 2.8% lower YoY compared to February 2024.
- The contract-to-spot spread increased by over $0.10 MoM, rising from $0.36 in January to $0.46 in February.
Summary
Following four consecutive months of growth, national average spot rates, excluding fuel, experienced a sharp decline in February, underperforming typical seasonal trends for the month. The MoM decrease in average spot linehaul rates – just under $0.11 – nearly offset the cumulative gains of just over $0.13 recorded since October. This represented the most significant monthly decline since May 2022, when rates fell approximately $0.12 MoM in the early stages of the current downcycle. From a seasonality standpoint, February’s 5.6% MoM decline was notably steeper than both the historical and pre-pandemic average decline of 2.8% for the month.
Despite this considerable drop, national average spot rates remained elevated on a YoY basis for the seventh consecutive month. However, the YoY margin narrowed to just 1.2%, marking its lowest point since turning positive in August 2023. After peaking at 5.2% in October and moderating through the end of the year, the YoY differential has steadily contracted over the first two months of 2024.
A closer examination of the monthly rate fluctuations indicates that weekly trends aligned more closely with seasonal patterns. According to the DAT 7-Day Average Spot Linehaul Rate Index, the first two weeks of February saw a continuation of the WoW declines that began in January, with average spot rates dropping by nearly $0.06 in total. Following five consecutive weeks of decline, the index recorded a modest increase of just over $0.01 WoW in the third week of February before stabilizing and remaining virtually unchanged in the final week of the month.
In contrast to the volatility in the spot market, initially reported average contract rates, excluding surcharges, remained stable in February, unchanged from January levels. Over the past 12 months, contract linehaul rates have fluctuated within a narrow range, with the monthly rate of change registering just 0.1%. On an annual basis, contract rates, excluding fuel, were marginally lower – by just over one cent per mile – compared to February 2023.
According to DAT Freight & Analytics, the rate differential, which measures the gap between new shipper contract rates and the rates they replace, increased to 2.6% in January. The differential has remained in the low single-digit positive range for several months, signaling the market’s transition out of the pandemic trucking cycle and indicating that carriers are securing incremental gains in contract negotiations. With contract rates holding steady MoM while spot rates declined sharply, the contract-to-spot rate spread widened to $0.46 in February, up from $0.37 in January and slightly exceeding the pre-pandemic average range.
Why It Matters:
The decline in average spot rates during the second month of the year was not unexpected, given that February historically experiences the largest MoM decreases compared to any other period. Much of this decline can be attributed to a market correction, as January’s seasonal demand fluctuations – driven by the residual effects of the holiday period – typically keep rates temporarily elevated before adjusting to the realities of a weaker demand environment. This effect was particularly pronounced this year, as winter storms in January caused widespread capacity disruptions, leading to unseasonal rate increases in the opening month. A similar trend was observed in 2024 as well as heightened spot rates in January, driven by winter storm–related disruptions, led to larger MoM declines of just over $0.09 the following month.
However, considering the ongoing capacity attrition observed over the past year, February’s significant correction in spot rates may signal that the market’s path to equilibrium could take longer than previously anticipated. Despite notable contractions in supply, truckload capacity continues to exceed the persistently weak demand environment. This sentiment is reflected in the most recent Logistics Managers’ Index® (LMI®) Report for February, which highlighted that loosening capacity levels likely prevented transportation prices from sustaining the momentum recorded over the past four months. According to the report, after reaching its highest level in nearly three years at 70.4% in January, the Transportation Prices Index declined by 4.9% in February – the largest MoM drop since April 2024 – settling at 65.5%. Nevertheless, despite this sharp decrease, the report noted that February’s reading of the Transportation Prices Index expanding at 65.5% was still 10 percentage points higher than capacity expansion, indicating the market is still heading in an overall positive direction. Though, it still may be too early to determine if an inflection point remains within reach.
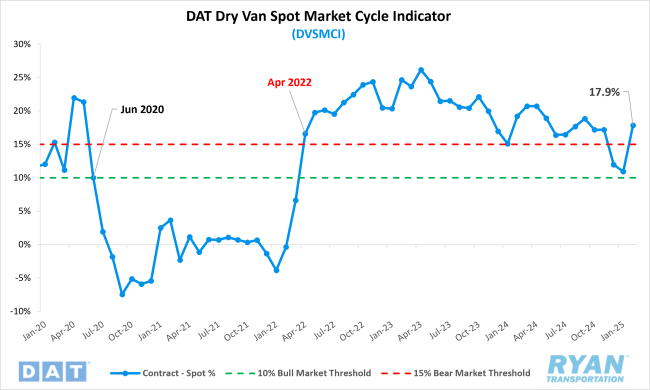
Regardless of which factor was the primary driver behind February’s decline, one certainty remains: it was a difficult month that did little in clearing the way for the truckload sector’s path to recovery. The Dry Van Spot Market Cycle Indicator (DVSMCI), which tracks the ratio between spot and contract rates, reflected this downturn, as the February decline in average spot rates pushed the index fully back into bear market territory at 17.9%, following its near three-year low of 10.9% in January. According to Jason Miller, Interim Chair of the Department of Supply Chain Management at Michigan State University and creator of the DVSMCI, a ratio above 15% indicates bearish market conditions, while a ratio below 10% signals a more bullish market. The uncertainty surrounding when truckload market conditions will stabilize – particularly in light of February’s weakness – places added pressure on March, which could serve as a pivotal month in determining whether a sustained market recovery can commence in the first half of 2025.