Back to March 2025 Industry Update
March 2025 Industry Update: Truckload Supply
Ongoing supply contractions have resulted in a tighter market compared to years past but still remains elevated compared to demand.
Key Points
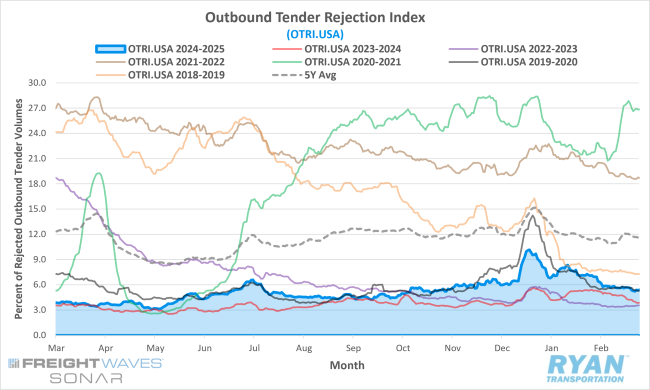
- The FreightWaves SONAR Outbound Tender Rejection Index (OTRI.USA), a measure of relative capacity based on carriers’ willingness to accept freight volumes under contract reflected as a percentage, ended February 1.63% lower compared to the end of January, falling from 6.95% in January to 5.32% in February.
- The 21-day trailing monthly average of daily tender rejections in February was down 1.9% compared to January, dropping from 7.5% to 5.6%.
- On an annual basis, average daily tender rejections were up 1.08% compared to February 2024, but 5.68% below the 5-year average.
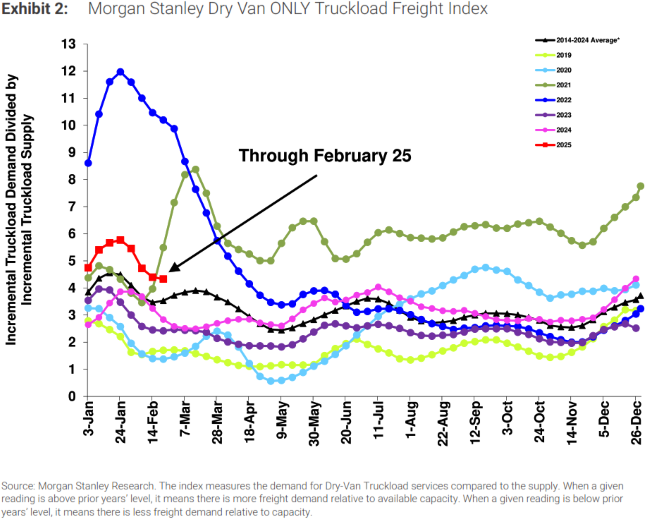
- The Morgan Stanley Truckload Freight Index (MSTLFI) decreased sequentially and underperformed typical seasonality in February after strongly outperforming in January, driven primarily by continued weakness in the demand component.
Summary
Despite subdued demand performance, tender rejection rates exhibited signs of stabilization throughout February. While monthly comparisons appeared volatile, the weekly declines in the OTRI largely aligned with typical seasonal trends, with the exception of the first week. Elevated rates in January, driven by winter storm disruptions, gave way to seasonal pressures in February, resulting in a sharp correction in rejection rates during the first week – a 136 bps WoW decline – marking one of the most significant weekly drops in the past year outside of holiday periods. However, following this initial decline, the rejection index continued to trend downward at a more measured pace, averaging approximately 37 bps lower WoW for the remainder of the month.
On an annual basis, YoY comparisons in outbound rejection rates continued their upward trajectory for the 14th consecutive month in February, underscoring the impact of ongoing capacity exits, which have contributed to an overall tighter market. Although the monthly average of daily tender rejections declined 1.6% MoM – the largest MoM decrease since April 2022 (-2.3%) – it remained 65 bps higher than the 2024 average and nearly 200 bps above the 2023 average.
According to the latest Morgan Stanley report, the Truckload Freight Index underperformed relative to typical seasonal expectations, largely due to persistent weakness in demand despite a relatively strong supply-side performance. The report indicates that the demand component declined by 1,940 bps in February, significantly exceeding the historical seasonal average decline of 1,220 bps for the month. Conversely, the supply component increased by 600 bps, well below its typical seasonal rise of 1,820 bps for February. Forward-looking sentiment remained mixed but leaned slightly more negative compared to the prior month’s outlook, with respondents citing excess capacity and softening demand as key factors limiting upward rate momentum.
Why It Matters:
February’s data further underscores the gradual rebalancing of the market following supply contractions in recent years. This shift was most evident in the relative stability of tender rejection rates throughout the month, despite retreating from their year-to-date peak. While the moderate decline in tender rejections was anticipated, their limited response to a sharp drop in truckload volumes was somewhat uncharacteristic. As OTRI values remain elevated on a YoY basis, the market remains vulnerable to potential disruptions and demand-side catalysts.
Despite the tightening capacity conditions observed in the first two months of the year, the continued absence of upward pressure on rates suggests that excess capacity is still absorbing incremental demand. According to the January 2025 Cass Transportation Index Report, private fleet expansion and utilization remain the primary headwinds to growth in for-hire freight volumes – consistent with trends throughout the current downturn. However, as contractual rates across the for-hire sector remain weak, the cost advantages of insourcing have diminished, leading to a deceleration in private fleet expansion and a gradual return to long-term outsourcing trends. While this shift is a positive indicator for future for-hire market conditions, capacity decisions will likely be influenced by forthcoming industry regulations set to take effect over the next two years.
Further signs of supply realignment with historical norms can be observed in the slowing pace of fleet reductions among publicly traded truckload carriers in Q4 2024. According to FTR data, truck counts for large U.S. truckload carriers declined approximately 5% YoY in Q4, a moderation from the nearly 7% YoY decline recorded in Q3. Additional evidence of easing capacity cuts is reflected in S&P Global’s Journal of Commerce Truckload Capacity Index (TCI), which declined from 76.6% in Q3 2024 to 75.7% in Q4 2024 – its lowest level in a decade. The Q4 TCI reading remains 18.8% below its mid-2022 peak of 93.2%. Across earnings calls, executives indicated that truck count growth is likely to remain constrained through the first half of 2025, though expectations suggest that as capacity continues to exit the market, growth may begin to rebound before year-end.