
Executive Summary
Conditions in the transportation industry and overall economy remain mixed between varying degrees of upside and downside potentials. For transportation providers, July proved to be more difficult compared to the previous two months as demand plateaued, leading to a continuation of downward pressure on rates. Economic indicators from June and July offered some positive signals, though these were largely overshadowed by a cautious outlook.
On the positive side, initial Q2 GDP estimates came in at 2.8%, exceeding expectations and doubling the Q1 rate as segments related to freight transportation showed strong growth. Additionally, industrial production posted solid gains in June following a robust performance in May, and housing starts saw an increase. However, these gains were tempered by a weaker-than-expected July jobs report, indicating a slowdown in demand growth. Net payroll employment gains were limited to 85,000 jobs in July following downward revisions, while the unemployment rate edged up to 4.3%. The manufacturing sector showed signs of weakness, with new orders declining significantly, and overall construction activity remained subdued. Consumer spending is also beginning to show strain, as real disposable income has seen minimal growth this year and personal savings rates have fallen to their lowest levels since 2008. With anticipated interest rate cuts at the next Federal Reserve meeting, the likelihood of achieving a soft landing for the economy appears to be diminishing.
Despite the mixed economic outlook, the transportation industry is beginning to show signs of cautious optimism. Although demand stability wavered in July due to weakening in the domestic manufacturing and retail sectors, it remained above levels seen in the previous year. While excess capacity continues to challenge growth, further reductions in the carrier population are helping to bring the truckload market closer to equilibrium. Additionally, sustained strength in imports has bolstered rail volumes as the industry heads into its traditional peak season, allowing rates to record consecutive gains over the past two months.
Main Takeaways
- Economy: U.S. manufacturing activity contracted for the fourth consecutive month in July, with accelerating declines driven by weak demand, continued contraction in new orders and reduced production and employment levels across all major manufacturing industries.
- Truckload Rates: Declines in spot market rates outperformed typical seasonality in July while contract rates remained stable.
- Truckload Demand: Freight demand slowed in July but remained elevated above the previous year’s levels, reflecting ongoing recovery in volumes.
- Truckload Supply: After hitting a two-year high ahead of the Fourth of July, tender rejections dipped in July and continue to closely mirror the levels recorded in 2019.
- Truckload Capacity Outlook: The declines in the for-hire carrier population accelerated in July as Class 8 orders slowed.
- Fuel: The average benchmark price of diesel rose for the first time in four months despite continued weakening global demand.
- OTR By Mode
- Dry Van: Van rates and volumes both registered declines in July but remain elevated compared to levels recorded in July 2023.
- Reefer: Reefer activity trended in line with van activity, as rates and volumes dipped slightly from June but were higher compared to previous year levels.
- Flatbed: The flatbed sector continues to perform the worst of the three major modal types, as rates and volumes declined in July and remain below 2023 levels.
- Intermodal: Overall volumes continued to gain traction in July, as rates saw minimal growth due to ongoing competition with weak truckload conditions.
Industry Overview
July Key Figures (YoY)
| Truck Data Points | YoY% Change |
| DAT Spot Rates (incl. FSC) | -0.8% q |
| Fuel Prices | -1.9% q |
| ACT Class 8 Preliminary Orders | -13.0% q |
| ATA NSA Truck Tonnage* | -4.2% q |
| Cass Freight Index** | -3.2% q |
| Cass Freight Expenditures | -6.2% q |
| Cass Freight Shipments | -1.1% q |
*Report released 7/23/24
**Report released on 8/14/2024
Economy
United States ISM Manufacturing PMI
Key Points
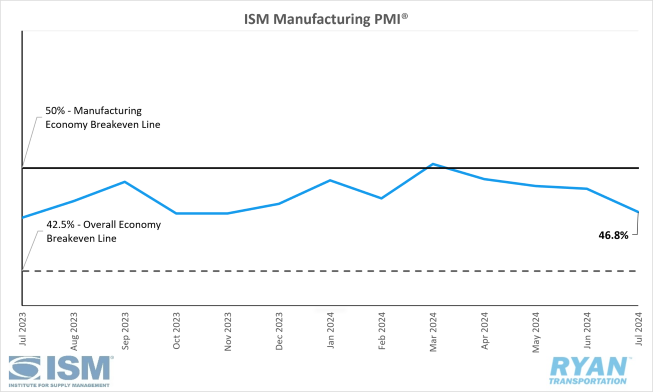
- The ISM Manufacturing PMI® registered 46.8% in July, a 1.7% decline from the 48.5% recorded in June.
- The New Orders Index remained in contraction territory, dropping to 47.4% in July, a 1.9% decrease from June’s figure of 49.3%.
- The Production Index contracted further, falling 2.6% from 48.5% in June to 45.9% in July.
- The Employment Index registered 43.4% in July, 5.9% lower than June’s reading of 49.3%.
- Customers’ Inventories Index moved into “too low” territory in July, dropping from 47.4% in June to 45.8%.
Summary
U.S. manufacturing activity contracted for the fourth consecutive month in July, accelerating its decline from June, according to the latest ISM Manufacturing PMI® reading. Persistent weak demand across the sector has resulted in further output declines while input levels have remained accommodating. Notably, the July PMI® reading marked 51 consecutive months of expansion for the overall economy, as a PMI® reading above 42.5% typically indicates economic growth over time.
The deceleration in demand components within the composite index was primarily evidenced by the continued contraction of the New Orders Index. The report indicates that, although a seasonal reduction is customary during the summer, new orders are falling below expectations as sales remain sluggish. Consequently, the Backlog of Orders Index remains firmly in contraction at 41.7%, unchanged from June. However, the report did highlight a positive development with the further contraction of the Customers’ Inventories Index, which decreased by 1.6% in July. This shifted the index from "just right" to "too low" territory, suggesting a potential uptick in future production.
The output components, represented by the Production and Employment Indices, declined from June, contributing to an overall 8.5% negative impact on the Manufacturing PMI® calculation. Production levels continue to struggle due to weak new orders and backlogs, coupled with companies' reluctance to invest in inventory amidst economic uncertainty. The Employment Index reached its lowest point since June 2020, registering at 42%. Survey respondents indicated that companies are reducing headcounts through layoffs, attrition and hiring freezes, with comments on staff reductions nearly doubling those on hiring.
The six largest manufacturing industries, (Machinery; Transportation Equipment; Fabricated Metal Products; Food, Beverage & Tobacco Products; Chemical Products; and Computer & Electronic Products) all registered contraction in July.
Why it Matters:
In recent months, the Manufacturing PMI® reports have suggested stability in the manufacturing sector despite an ongoing slump. However, the latest report raised concerns. Timothy R. Fiore, Chair of the Institute of Supply Management® Manufacturing Business Survey Committee, described several July data points as “alarming.” Notably, the composite PMI® saw a nearly 2% decline, with a 1.7% drop from June’s figure—the most significant since October 2023. Additionally, the share of manufacturing sector GDP with a PMI® at or below 45%, a key indicator of manufacturing strength, surged by 39% to 53% in July from 14% in June.
July’s report indicates an accelerating economic slowdown, posing challenges for the Federal Reserve's dual mandate, as the Employment Index contracted sharply while the Prices Index increased. Elevated interest rates have hindered further investments in inventories and employment, and the manufacturing sector is unlikely to gain momentum until borrowing costs decrease. Although a potential interest rate cut by the Federal Reserve in September might help, its effects would not be immediate and could take at least a quarter to influence the PMI® data.
Furthermore, uncertainty over the November election results has led manufacturers to delay investments. Federal investment policies, especially concerning energy, play a significant role in business planning. The stark differences between the two parties' policies are causing companies to hold back on investments ahead of a potential administration change to avoid unfavorable outcomes beyond their control.
Macro Economy
- Nonfarm payroll employment added 114,000 jobs MoM in July on a seasonally adjusted basis following downward revisions to both May and June figures, according to the most recent jobs report from Bureau of Labor Statistics (BLS).
- The unemployment rate rose by 0.2% MoM in July to 4.3% for the highest reading since October 2021 and is in line with the average unemployment rate between 2015 and 2019.
- Total Transportation and Warehousing employment added 14,000 jobs in July on a seasonally adjusted basis, driven by increases in Couriers and Messengers and Warehousing and Storage.
- Total Truck Transportation declined by 2,400 jobs in July on a seasonally adjusted basis, following downward revisions for May and June of 1,500 jobs.
- Total Warehousing and Storage employment increased by 10,700 jobs on a seasonally adjusted basis in July.
- The headline Personal Consumption Expenditures (PCE) Prices Index rose 0.1% MoM in June while core PCE, which excludes food and energy and is the Fed’s preferred gauge for measuring inflation, rose by 0.2% MoM on a seasonally adjusted basis, according to the most recent report released by the Bureau of Economic Analysis (BEA).
- On an annual basis, the all-items PCE index rose 2.5% in June on a seasonally adjusted basis, down 0.1% from the 2.6% recorded in May.
- Core PCE over the last 12 months registered a 2.6% increase in June on a seasonally adjusted basis and was unchanged from May.
- At its July 31 meeting, the Federal Reserve kept benchmark interest rates at their current level of 5.25%-5.50%.
- According to the CME Fedwatch Tool, at the time of this writing, probabilities are narrowly split between a 25 bps rate cut (50.5%) and a 50 bps rate cut (49.5%) at the next Fed meeting on September 18.
Truckload Rates
Spot Rates
Key Points
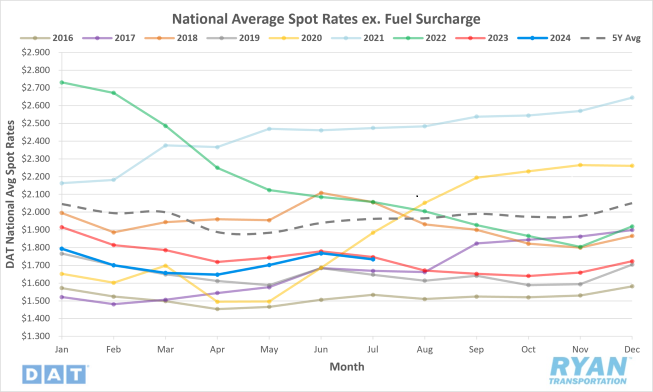
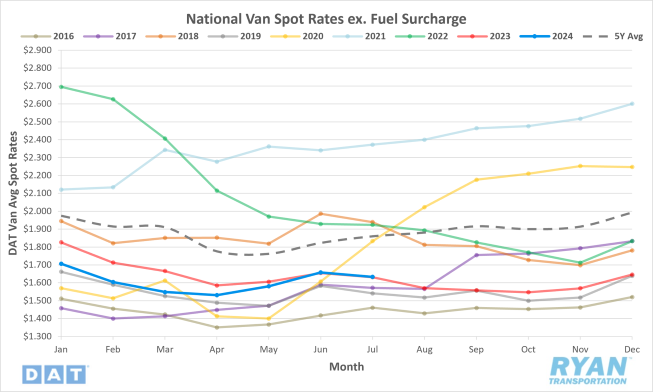
- The national average spot rate excluding fuel declined 1.9% MoM, or $0.03, in July to $1.73.
- Compared to July 2023, average spot linehaul rates were 0.7% lower and registered 11.6% below the 5-year average.
Key Points
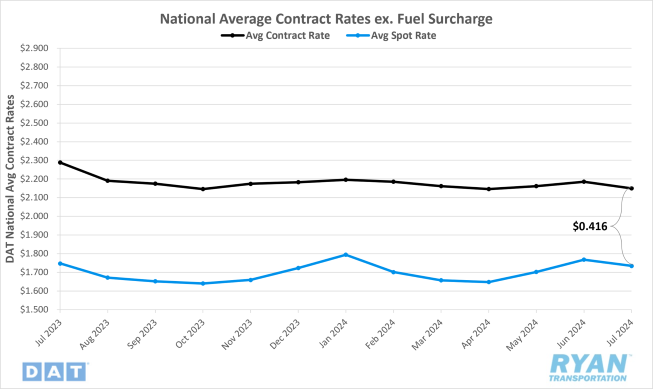
- Initially reported average contract rates excluding a fuel surcharge declined 1.6% MoM, or roughly $0.04, in July.
- On an annual basis, average contract linehaul rates are 6% lower compared to July 2023.
- The contract-to-spot spread was virtually unchanged in July from June, remaining at $0.42.
Summary
Average spot rates declined in July after two consecutive months of increases, surpassing typical seasonal declines for this period. The 1.9% MoM decrease significantly exceeded the pre-pandemic seasonal average decline of 0.5% and the post-pandemic average decline of 1.1%. Despite ongoing volatility in monthly variations, annual comparisons are showing improvement, with July recording the second lowest YoY differential (0.7%) since the current cycle's downturn, just behind June's recording of 0.6%.
According to the DAT 7-day linehaul spot rate index, average spot linehaul rates decreased by nearly $0.07 in July, with most of the decline occurring in the two weeks following the Fourth of July holiday. The index remained relatively stable in the week leading up to the holiday, then dropped by $0.02 the following week and by just under $0.05 in the subsequent week.
In the contract market, initially reported average rates experienced their largest MoM decline since August 2023, following moderate increases in the preceding two months. Despite this decline, monthly contract rate movements in 2024 have remained within a narrow range, averaging less than $0.01. Annual comparisons are improving, with contract rates narrowing from 10-12% lower at the start of the year to within 6-8% of last year’s levels. Consequently, the contract-to-spot spread remained stable and within the typical pre-pandemic range, despite declines in both spot and contract rates in July.
Why It Matters:
The decline in spot market rates in July was anticipated as summer shipping volumes typically diminish following the Fourth of July holiday, with capacity returning to the market absent any immediate disruptions. Despite outperforming the usual seasonal decline, July's spot rates remained approximately $0.02 higher than the average recorded during the first six months of the year. This elevation is largely due to the rally in spot rates that commenced in mid-May during the CVSA International Roadcheck, which reset the rate baseline for the summer shipping season. However, the volatility in spot rates is unlikely to persist nationally, as significant capacity disruptions are limited to the Labor Day holiday in September.
On the contract side, the narrow range within which rates have fluctuated throughout 2024 likely indicates that a floor has been reached. The overall stability in contract rates suggests that further rate negotiations are largely concluded, as publicly traded carriers have emphasized their unwillingness to continue concessions during earnings calls. With contract rates stabilized, the focus will shift back to service level prioritizations, making longer-term contracts more favorable.
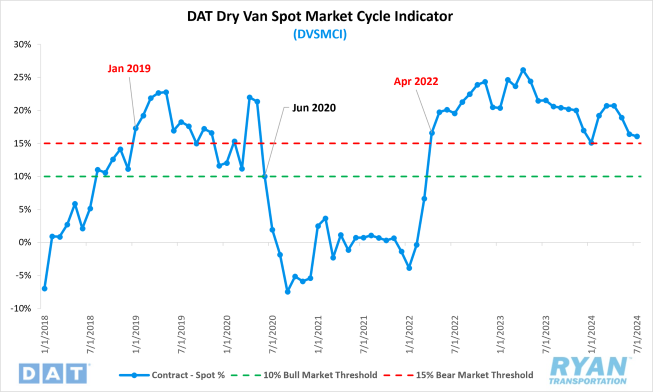
Jason Miller, Interim Chair of the Department of Supply Chain Management at Michigan State University, explains that the ratio between spot and contract rates can provide insight into whether the market is experiencing bullish or bearish pricing. Miller’s methodology, which calculates the difference between contract and spot rates as a factor of their average, suggests that a ratio below 10% indicates a bull market, while a ratio above 15% reflects a bear market. In a recent LinkedIn post, Miller noted that July's ratio is around 16%, significantly above the 10% threshold, with little indication of an imminent market turnaround. As illustrated in the accompanying graph, the threshold has remained above 19% for most of the period between May 2022 and April 2024.
Truckload Demand
Key Points
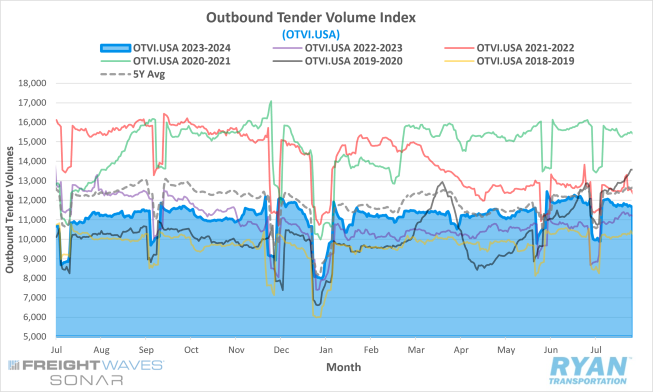
- The FreightWaves SONAR Outbound Tender Volume Index (OTVI.USA), a measure of contracted tender volumes across all modes, registered 1.2% lower at the end of July compared to the levels recorded at the end of June, dropping from 11,880.53 to 11,741.97.
- The monthly average of daily tender volumes in July was 4.4% lower MoM compared to June, decreasing from the 11,947.07 average from June to July’s average of 11,423.27.
- On an annual basis, average daily tender volumes recorded by the FreightWaves SONAR OTVI in July were 8.7% higher than the levels recorded in July 2023 but remain 5.2% below the 5-year average.
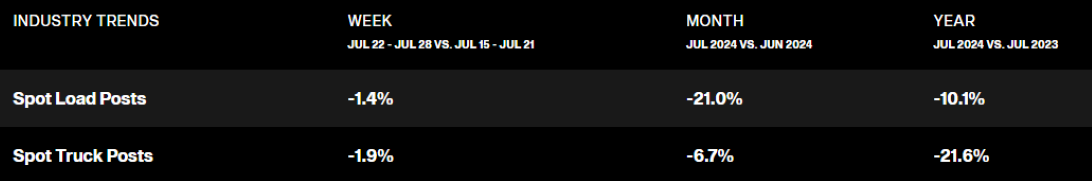
- Spot market volumes continued their decline from the surge experienced in May, with spot activity dropping 21% MoM in July and sitting 10.1% below YoY levels, according to DAT.
- The Cass Freight Index Report, which analyzes the number of freight shipments in North America and the total dollar value spent on those shipments, declined on a monthly basis for both shipments and expenditures by 1.8% and 3.0%, respectively, in June, with both registering lower compared to last year by 6.0% and 9.4%, respectively.
Summary
The resilience in freight demand observed during the first half of 2024 concluded in July, aligning with seasonal expectations. Tender volumes, which had rallied ahead of Memorial Day and maintained momentum into June, led to the FreightWaves SONAR OTVI reaching its highest level since September 2022 in the final week of June. However, the seasonal downturn following the Fourth of July holiday caused freight activity to stall in July. Despite trending lower, the 1.2% MoM decline in tender volumes at the end of July was less than the typical seasonal decline, suggesting some stability remains. Although monthly volumes were lower, annual comparisons remained elevated above the levels recorded in the same month last year, with the OTVI closing out July 4.4% higher than at the end of July 2023.
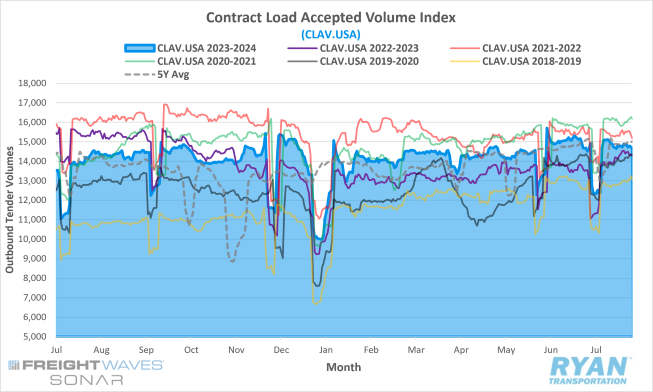
Volumes running under contract continued to dominate the truckload landscape in July, as excess capacity persists in the market. According to the FreightWaves SONAR Contract Load Accepted Volume Index (CLAV.USA), which excludes rejection rates, volumes accepted under contract were 0.7% higher at the end of July compared to the end of June. On an annual basis, the monthly average of daily accepted contract tenders was up 6.5% compared to the average recorded in July 2023. While the YoY increase is the second smallest this year, behind May, the continued positive trend further indicates that demand levels are continuing to recover.
Why It Matters:
While the decline in volumes made July more challenging than June for service providers, it is encouraging to note that recent trends suggest seasonality has returned. Despite showing resilience in the first half of 2024, demand remains insufficient to offset the existing excess capacity.
Unfortunately, several of the anticipated catalysts for market recovery are beginning to exhibit signs of weakness, raising concerns about their sustainability through the remainder of the year. Consumer spending, which has been a significant driver of volume strength in 2024, is now showing signs of waning. With pandemic-era savings depleted and credit card delinquencies on the rise, consumers appear to be pulling back, particularly as the November elections approach. Similarly, Industrial Production, which supported freight demand in the first two quarters, is now facing indicators of a potential decline in domestic manufacturing.
One catalyst that some analysts have highlighted as a driver of freight volumes for the remainder of the year is the continued strength of imports. In the first six months of 2024, total twenty-foot equivalent units (TEUs) increased by 13.1% compared to the same period in 2023. While these imports are typically moved inland by domestic intermodal carriers, with only a small portion affecting surface freight volumes, there is speculation that the weakness in the over-the-road (OTR) market has allowed truckload carriers to capture a larger share.
However, recent reports from the Journal of Commerce indicate that these imports are not being funneled down from ocean carriers to truckload carriers or intermodal rail providers. Instead, they are moving inland intact via international ocean containers. The Intermodal Association of North America reported a 13.3% growth in international intermodal volumes in Q2 compared to Q1, while domestic intermodal volumes increased by only 4.9%. Meanwhile, J.B. Hunt, the largest intermodal company in North America, reported that its intermodal volumes were essentially unchanged year-over-year in Q2.
Regarding the surge in imports this year, intermodal experts believe that customers are pulling some of their freight forward ahead of peak season. Several factors may be driving this trend, including longer ocean transit times around Cape Horn in Africa to avoid the conflict taking place in the Red Sea, strong consumer spending in 2024 and the potential for future tariffs following the election. Regardless of the reasons, this has resulted in an early peak season for ocean freight, which may reduce the volume available for domestic truckload and intermodal carriers during the traditional peak seasons.
Truckload Supply
Key Points
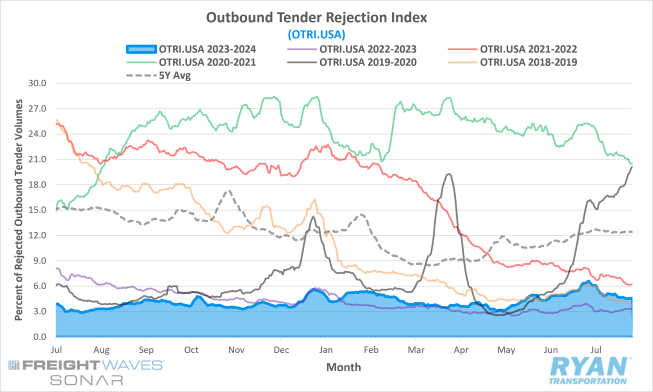
- The FreightWaves SONAR Outbound Tender Rejection Index (OTRI.USA), a measure of relative capacity based on carriers’ willingness to accept freight volumes under contract reflected as a percentage, registered a 1.8% decline MoM at the end of July compared to the end of June.
- The monthly average of daily tender rejections in July was 0.04% higher MoM compared to June, increasing from 5.16% to 5.20%.
- Compared to July 2023, average tender rejections were 2% higher but remained 5.71% below the 5-year average.
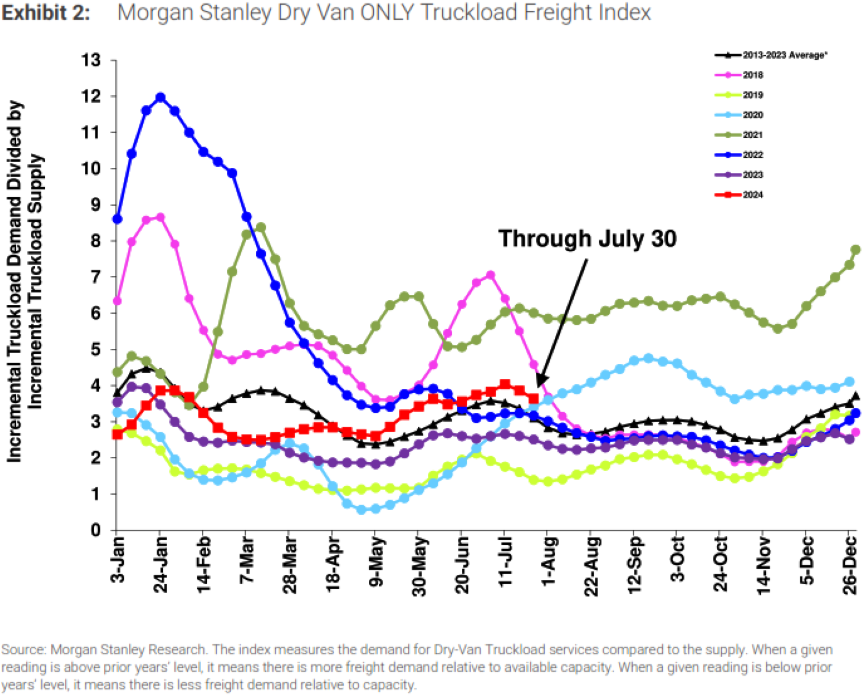
- The Morgan Stanley Truckload Freight Index (MSTLFI) increased through the first half of July before declining sequentially in the back of the month, but outperformed typical seasonality and has remained above the long-term average since mid-April.
Summary
Following a rally that commenced in the latter half of June, the FreightWaves SONAR OTRI peaked at 6.59% in the days leading up to the Fourth of July holiday, marking its highest reading since late July 2022. As drivers returned to the road after the holiday, the growth in tender rejections plateaued yet remained above 5% through most of the first half of the month. However, in the final weeks of the month, tender rejections declined as the reality of persistent excess supply became apparent, closing the month 55 bps lower than the levels recorded mid-month. Despite these declines, rejection rates at the end of July 2024 were still 1.23% higher than at the end of July 2023.
When compared to previous years, tender rejections over the last three months have closely mirrored those of 2019, the industry’s last recessionary period. Between May and June 2024, the average rejection index values were approximately 0.22% lower than those recorded in 2019. However, this average increased by 52 bps in July, suggesting that the impact of seasonality was less pronounced this year compared to the oversupplied market of 2019. Should this trend persist, and in the absence of any significant capacity-disrupting events, rejection values could begin rising in August and maintain that momentum through the end of the year.
According to the most recent Morgan Stanley report, the stronger-than-expected seasonality observed in the MSTLFI was largely driven by a sharp contraction in supply. The report indicates that the supply component registered an increase of ~80 bps, compared to its average increase of around ~720 bps during the update, signaling a continued exit of capacity from the market, albeit at a slower pace than anticipated. The rebalancing of supply relative to demand is evident, with the index remaining above both last year’s levels and long-term averages.
Why It Matters:
The ongoing improvement in seasonality suggests that the contraction in supply is gradually moving the market closer to equilibrium. However, concerns persist regarding the sustainability of this trend through the second half of the year. The stability of freight volumes in 2024 has tempered the rate at which capacity exits the market, defying earlier expectations. If demand continues to strengthen throughout the remainder of the year, capacity will likely persist until it becomes financially unsustainable.
The similarity between current rejection trends and those observed in 2019 is an encouraging sign that the truckload industry's cyclical and predictable nature is re-emerging. As in 2019, rejection rates surged around the Fourth of July holiday before declining through mid-August and then rising steadily through year-end. Unlike in 2019, however, the supply of trucking providers remains significantly above pre-pandemic levels. Nevertheless, the recent spike in tender rejections around the holiday indicates that capacity has contracted to a point where it is vulnerable to external disruptions. Given the heightened hurricane activity forecasted this year, further stress on supply levels is a high possibility.
Truckload Capacity Outlook
Key Points
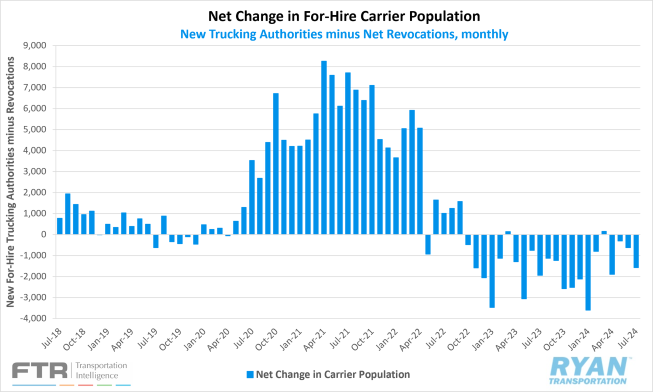
- Total net revocations, a measure of total authority rejections minus reinstatements, jumped in July by 933 carriers, increasing from 5,249 revocations to 6,182, according to FTR’s preliminary analysis of the Federal Motor Carrier Safety Administration’s (FMCSA) data.
- The number of newly authorized for-hire trucking companies declined slightly by just 17 carriers in July, dropping from 4,629 new authorities to 4,612 carriers, per FTR’s reporting.
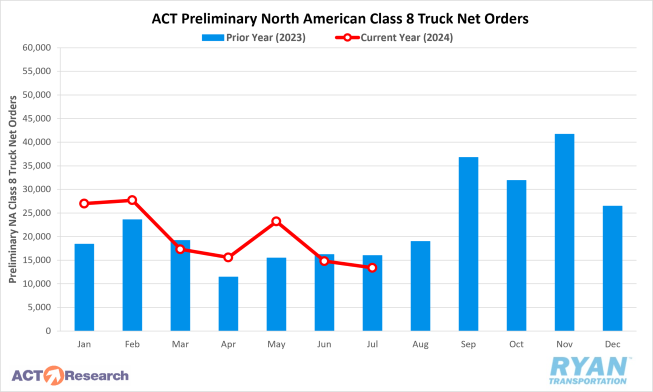
- Preliminary North American Class 8 Orders in July ranged from 12,400 units as reported by FTR to 13,400 units per ACT Research, with both estimates registering lower annually by 7% and 13%, respectively.
Summary
The decline in the for-hire carrier population accelerated in July, with a decrease of 1,570 carriers, more than doubling the 620-carrier decline recorded in June. This surge in contraction was primarily driven by an increase in net revocations, while new authorizations remained relatively stable. After revocations showed signs of slowing in Q2, July's figures returned to levels comparable to those observed at the end of 2023.
Capacity exits continue to disproportionately affect smaller operations, as FMCSA data indicated that approximately 32,500 carriers exited the industry between December 2022 and June 2024. However, the reduction in capacity is not confined to smaller carriers alone; many larger fleets are also beginning to reduce capacity. According to the Journal of Commerce Truckload Capacity Index (TCI), which tracks truck counts from a group of large truckload carriers, collective truck capacity was reduced by 9.5% YoY in Q2, with individual reductions ranging from 6% to 11%.
Meanwhile, the decline in newly authorized carriers continued to slow in July, with a decrease of only 17 carriers compared to June's levels. FTR's preliminary analysis of FMCSA data reveals that the average number of new for-hire carriers in 2024 is approximately 6,000 fewer than the peak period in 2021. Although the average number of new authorizations in 2024 is just over 4,700 carriers—still well above the typical pre-pandemic level—they remain elevated. For comparison, in 2018, the strongest year prior to 2020, the monthly average of new carriers was 3,660.
Preliminary North American Class 8 orders further declined in July, with analysts reporting demand levels at or slightly below seasonal expectations. According to ACT Research, July is typically the weakest month of the year for Class 8 orders, often receiving the largest seasonal adjustment factor of nearly 24%. Applying this seasonal adjustment raises July's order activity to 17,500 units, narrowing the MoM decline to just 3.7%. FTR's reports indicate that order levels have dipped slightly below replacement demand, with the monthly average in 2024 falling to 19,400 units from 20,600 units. Despite orders being lower on a YoY basis for the second consecutive month, strong performance in the first half of the year has kept net orders YTD up 18% compared to the same period in 2023, according to FTR.
Why It Matters:
Following a slowdown over the past three months, the increase in net revocations in July aligns with the persistently challenging conditions in the truckload sector. However, according to FTR, this rise in total revocations was not entirely organic, as July included five Mondays, the day of the week when the FMCSA processes the highest number of revocations. FTR's report also highlights that freight brokerages are experiencing elevated declines, although at a slower rate than in 2023. July saw a net decrease of approximately 360 freight brokers, just over half the largest decline recorded last year, when a decrease of708 brokers was recorded in October 2023.
While changes in active for-hire trucking authorities, as reported by the FMCSA, offer some insight into current capacity levels, they do not fully capture the extent of oversupply in the market. Payroll employment in the trucking sector remains significantly elevated compared to the pandemic-driven surge in 2020. According to the most recent BLS jobs report, trucking payrolls are still 1.9% above February 2020 levels, marking the smallest gain over pre-pandemic levels since November 2021. A more detailed analysis, available through June, shows that while general freight truckload jobs have decreased by 11,700 on an annual basis, they remain 21,000 jobs above February 2020 levels. This indicates that the market has not yet reached a point of equilibrium.
The sustained decline in new carrier authorizations, coupled with the slowing of Class 8 orders, suggests a cautious outlook for capacity replenishment in the near term. With the ongoing reduction in operating authorities and payroll employment, as well as the continued slowdown in new entrants, the market appears to be trending closer to balance. If these conditions persist through the end of the year, the market may become increasingly vulnerable to supply constraints, particularly in the event of external disruptions.
Fuel Prices
Key Points
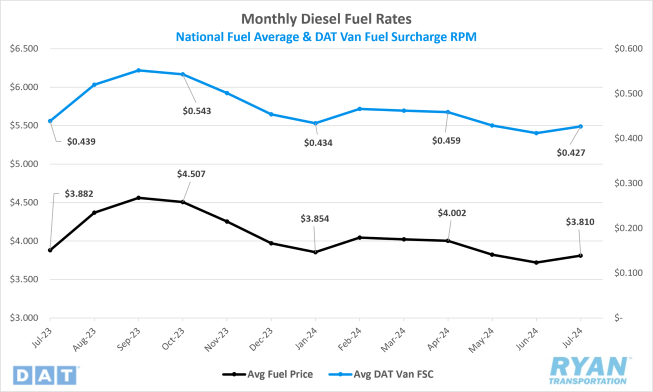
- The national average price of diesel increased in July, rising 2.4% MoM, or $0.088, from $3.722 to $3.810
- Compared to July 2023, the average diesel price was 1.9%, or $0.072, lower in July 2024.
- Draws on U.S. Crude Reserves outpaced builds in July and outperformed expectations, with the net change in commercial crude stocks declining by 15.5M bbls versus the consensus decline of 3.1M bbls for the weeks ending July 5 and July 26.
Summary
The average price of diesel rose in July, following four consecutive months of declines that totaled $0.322. This increase was largely driven by a four-week rally that began in the second half of June and extended through the first two weeks of July. The benchmark fuel price surged by over $0.04 week-over-week at the start of July, resulting in an average price increase of $0.09 month-over-month compared to the first week of June. The upward momentum continued into the second week, with average diesel prices rising by an additional $0.05 week-over-week, bringing the total increase over the four-week period to nearly $0.21. However, this positive trend stalled mid-July, with average fuel prices experiencing sequential declines through the end of the month, ultimately dropping just under $0.10 in the final three weeks.
Despite further drawdowns in crude reserves, inventories and production remained within normal ranges in July, with no indications of significant surpluses or shortages. Analysts noted that after a prolonged period of volatility, oil markets have settled into a tight trading range, which one leading analyst described as "very dull." According to the International Energy Agency's (IEA) monthly report, global oil demand continued to decelerate in the second quarter, with growth slowing to 710,000 barrels per day while global supply increased by 150,000 barrels per day, reaching a total output of 910,000 barrels per day. This dynamic has kept the Ultra-low Sulfur Diesel (ULSD) market in contango, a situation where the front-month value of diesel is the lowest relative to subsequent months.
Why It Matters:
As the peak summer consumption season passes its midpoint, the modest depletion of inventories and the absence of consistent price increases have left many analysts searching for explanations. Among the bearish factors cited are the potential for increased U.S. oil production under a new administration, which could exacerbate the global supply glut, as well as persistently weak demand signals, particularly the slow growth in Chinese demand. While bullish conditions have yet to materialize, some analysts remain optimistic about the near-term outlook, pointing to OPEC+'s supply reductions creating market imbalances and the potential for geopolitical conflicts, such as those between Israel and the Iran-backed Houthi rebels, to escalate into broader hostilities.
One critical factor to monitor, which appears to have more bearish implications for the fuel market, is OPEC+'s recent announcement of plans to gradually restore production cuts starting in October. Given the current market conditions, bringing additional supply online could only further depress oil prices. Despite some members exceeding their agreed production quotas, OPEC+ output has decreased by 680,000 barrels per day since December, according to a monthly survey from S&P Global Commodity Insights. While analysts have not ruled out the possibility of further production cuts by the oil cartel, there is widespread speculation that OPEC+ may not fully implement its new plan in October.
Dry Van Overview
Spot Rates
Key Points
- The national average dry van spot rate excluding fuel declined 1.5% MoM, or $0.03, in July to $1.63.
- Compared to July 2023, average dry van spot linehaul rates were slightly higher, increasing 0.1% YoY, and remain 12.2% below the 5-year average.
- Initially reported average dry van contract rates exclusive of fuel declined 1.7% MoM in July and registered 6.5% lower compared to July 2023.
Load-to-Truck Ratio
Key Points
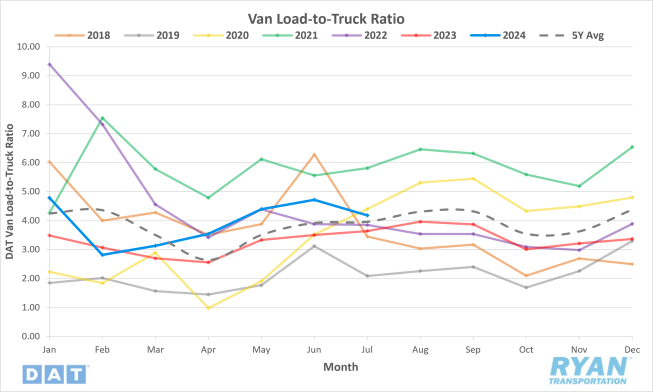
- The dry van load-to-truck ratio (LTR) registered 4.18 in July, 11.4% lower MoM compared to June but 14.8% higher compared to July 2023 levels.
Market Conditions
Dry Van Summary
The contract freight market, a key indicator of the trucking industry’s health, showed a 3.6% sequential increase in May (the latest reading available) in the American Trucking Association’s (ATA) Seasonally Adjusted (SA) For-Hire Truck Tonnage Index. With a YoY increase of 1.5%, this is the first YoY gain in fifteen months. However, ATA Chief Economist Bob Costello remains cautious about declaring a recovery in the trucking freight market. Of all the freight moved in May, 17% was moved on the spot market, according to DAT’s contract shipper consortium. There is notable concern about excess capacity still in the market and declining linehaul rates amongst carriers, specifically cross-border shippers between the U.S. and Canada.
The Logistics Manager’s Index (LMI) has been in expansion for seven consecutive months. However, inventory levels are down along with warehousing utilization. These are counteracted by decreases in warehousing capacity and transportation capacity, which came in at a reading of 50.0. This is the first month that the metric has moved out of expansion since March 2022. This tightening could signal the end of the freight recession, according to Zac Rogers of Colorado State University.
Jason Miller, supply chain expert at Michigan State University, emphasizes a need for more positive developments in trucking as demand remains subdued. He points out that absolute demand for trucking is near where it was in Q4 2018, and he does not expect much volume recovery this year. The nonmetallic mineral manufacturing sectors, which account for ~5% of truck demand, are trending down and construction and oil drilling are also slowing. There are positive signs, but the trucking industry still faces challenges on the road to recovery.
Reefer Overview
Spot Rates
Key Points
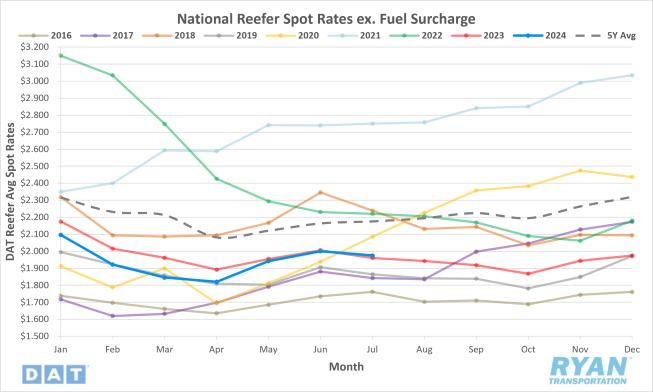
- The national average reefer spot rate excluding fuel decreased 1.3% MoM, or ~$0.03, in July to $1.96.
- Average reefer spot linehaul rates were 0.7% higher YoY compared to July 2023 and sit 10.1% below the 5-year average.
- Initially reported average reefer contract rates exclusive of fuel fell 1.1% MoM in July and were 3.9% lower compared to July 2023.
Load-to-Truck Ratio
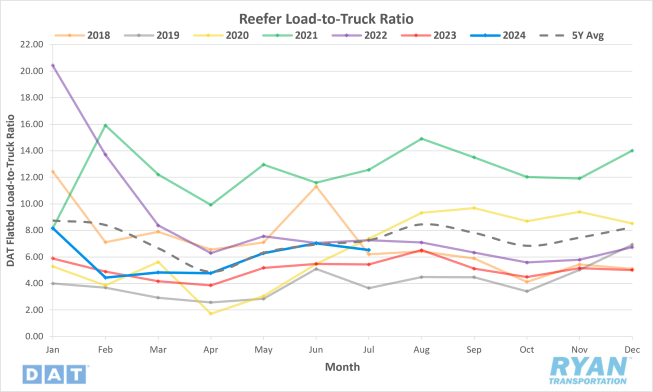
Key Points
- The reefer LTR declined 7.3% MoM to 6.52 in July but was 20.1% higher YoY compared to July 2023.
Market Conditions
Reefer Summary
Summer grilling season is in full swing, with July being National Hot Dog Month. Americans are expected to consume seven billion hot dogs during this period, with 55% of hot dog production consumed in July alone. This surge in demand translates to around 16,000 reefer loads, further boosting demand. Blueberry season is also in full swing in Hammonton, N.J., the self-proclaimed “Blueberry Capital of the World”. Despite other states producing more volume, New Jersey’s fresh blueberry market is crucial, with premiums placed on reefer capacity to transport these fragile loads to market.
California is having a mixed summer. Avocado production is seeing its best season since the start of the pandemic, with shipment volumes up 41% YoY. The California Avocado Commission (CAC) is projecting a total crop exceeding 250 million pounds, or about 6,000 reefer loads, which is about 20% higher than pre-season estimates. U.S. refrigerated exports have been finalized for Q1 and, according to IHS Markit, were up 9% YoY but at the lowest level in seven years. Oakland retained the top spot, accounting for 18% of export volume.
This time last year, the USDA reported a slight shortage of reefer trucks for loads of vegetables, particularly lettuce from the Salinas-Watsonville growing regions. This year, there are sufficient trucks for the demand, which is 9% lower than last year despite a 29% YoY increase in lettuce volume at the beginning of the month. However, strawberries, the number two commodity, are down 25% from last year. Reefer rates have been increasing on major lanes even though regional volumes are lower than last year.
Flatbed Overview
Spot Rates
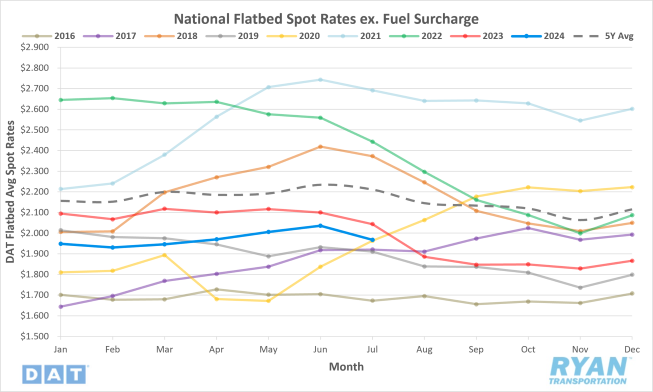
Key Points
- The national average flatbed spot rate excluding fuel declined 3.3% MoM, or ~$0.07, in July to $1.97.
- Compared to July 2023, the average flatbed linehaul spot rate was 3.7% lower YoY and registered 49.9% below the 5-year average.
- Initially reported average flatbed contract rates exclusive of fuel declined 1.4% MoM in July and were down 5.6% compared to July 2023.
Load-to-Truck Ratio
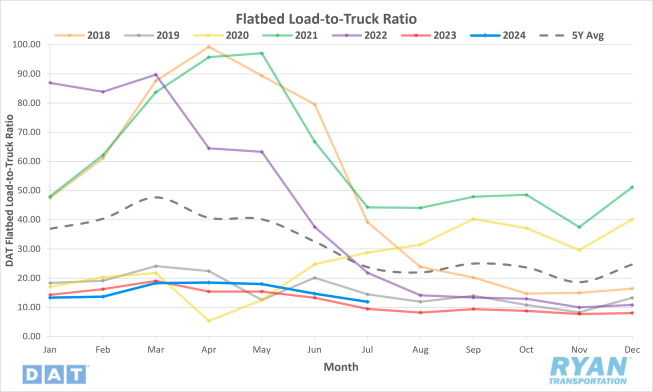
Key Points
- The flatbed LTR fell 18.8% MoM in July to 11.89 but was 26% higher than July 2023 levels.
Market Conditions
Flatbed Summary
Summer in the U.S. typically points to harvest time and farmers looking to add new equipment or replace their old equipment. However, sales of farm tractors and combines in the U.S. and Canada are significantly below the 5-year average, with U.S. sales down about 30% YoY. Overall farm tractor sales have decreased by 11.5% YoY, while combine sales dropped 17.7%. The Canadian market showed mixed results, with a notable 58.4% increase in combine sales in May but a total decline in sales year-to-date. These changes reflect broader challenges in the industry, including declining net farm income. The USDA reports that net farm income is expected to drop from 2023’s forecast of $155 billion to $116 billion. This is a 25.5% decrease and is the largest recorded YoY dollar decrease in net farm income.
This downturn has led to strategic shifts from major manufacturers. John Deere has announced layoffs of 890 employees in Iowa and Illinois, as well as plans to open a new factory in Mexico by 2026. AGCO and Case Hew Holland have also implemented workforce reductions and are shifting some production to Mexico. We are also past peak steel production from March each year, and load volumes fell off much faster than in prior years. According to American Iron & Steel Institute (AISI), steel production nationwide is down 1.6% from last year. However, in Indiana, the largest producer of steel nationally, volumes were down 9.4% YoY.
The flatbed market is seeing rates and demand decrease significantly. Cross-border rates between the U.S. and Canada have dropped, and some carriers are facing difficulties finding return loads, leading to parked equipment. As the agricultural and manufacturing sectors continue to struggle, these challenges are expected to persist.
Intermodal
Spot Rates
Key Points
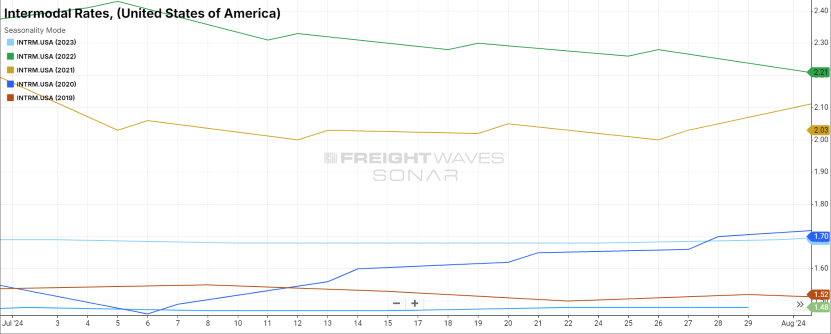
- The FreightWaves SONAR Intermodal Rates Index (INTRM.USA), which measures the average weekly all-in door-to-door intermodal spot rate for 53’ dry vans across a majority of origin-destination pairings, increased in July, rising 1.4% MoM, or $0.02, to $1.48.
- Compared to July 2023, intermodal spot rates were down 12.4% YoY and were 19.6% below the 5-year average.
Volumes
Key Points
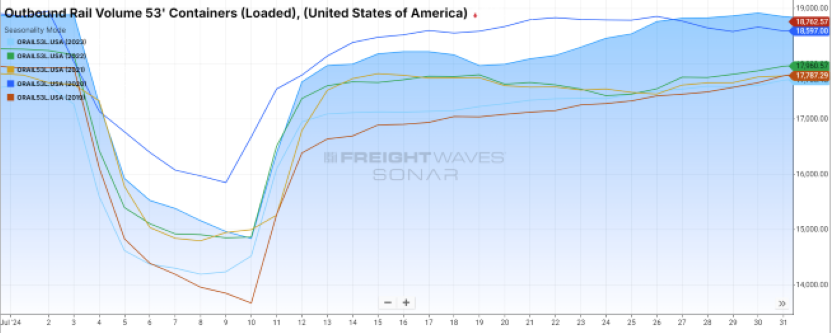
- Total loaded volumes for 53’ containers for all domestic markets, measured by the FreightWaves SONAR Loaded Outbound Rail Volume Index (ORAIL53L.USA), were virtually unchanged at the end of July compared to the end of June.
- Compared to the same time last year, total loaded volumes for 53’ containers were 6.5% higher YoY and were 4.9% above the 5-year average.
Intermodal Summary
Intermodal conditions experienced a gradual improvement in July, with overall volumes and rates registering gains, as reported by the Association of American Railroads (AAR). The upward momentum in intermodal volumes persisted, with intermodal containers and trailers increasing 8.4% YoY, translating to approximately 102,500 additional units. However, these substantial gains in intermodal traffic were offset by continued weakness in rail carloads, which saw a 2.1% YoY decline. Excluding coal, carloads were up 1.5% YoY, indicating that the overall decline in rail traffic was primarily driven by reduced coal shipments. The AAR report also noted a combined volume growth of 3.4% YoY, equivalent to an increase of around 79,200 units.
Notably, the growth in intermodal volumes during July was largely driven by the international market, which saw a 2.4% MoM increase, in contrast to a 1.7% MoM decline in domestic volumes. On an annual basis, international traffic outperformed domestic, with volumes rising 13.7% YoY compared to a 4.3% YoY increase for domestic carloads.
Rail spot rates continued to exhibit positive trends in July, marking the second consecutive month of improvement, though they remain significantly below the levels observed in 2023. Contract rates, however, remain suppressed due to ongoing competition with weak truckload conditions, which remains a significant challenge for the industry. According to the FreightWaves SONAR Intermodal Contract – Initial reporting of average base rate per mile Index (IMCRPM1.USA), contract market rates stood at $1.58 at the end of July, a slight decrease of $0.02 YoY. Following a record low in June, the FreightWaves SONAR Intermodal Contract Savings Index (IMCSI1.USA), which measures the percentage difference between initially reported dry van contract rates excluding fuel and initially reported intermodal contract rates excluding fuel, increased by 1.12% in July, closing the month at 7.77%.
Further Reading
Q2 U.S. Bank Freight Payment Index sees ongoing freight shipment and spend declines, at a reduced rate | Logistics Management
Potential East and Gulf Coasts port strike could drive up August U.S. import volumes, reports Port Tracker | Supply Chain 247
Class 8 Truck Orders Stumble Again in July | Transport Topics