
Executive Summary
With 2023 now in the books, there remains an unprecedented number of questions regarding the direction of the overall economy and transportation industry. Heading into an election year, it is likely that not many will be answered in the foreseeable future. In the broader economy, data continues to change month to month, with preliminary figures appearing promising one month, only to be revised down the next. Meanwhile, in the transportation sector, strong demand numbers indicating a market recovery is underway are met by excess capacity forcing conditions to further deteriorate.
Initial Q3 GDP estimates that were revised upward from 4.9% to 5.2% in November were revised once again back to their initial 4.9% in December by the Bureau of Economic Analysis. The labor market continues to defy expectations as payroll employment continues to increase while unemployment remains unfazed. Speculation remains undecided whether the economy is headed for a "soft landing" or mild recession. Much of the uncertainty stems from the quick change in tone coming from the Federal Reserve. After initially stating no policy easing was in sight at the start of the month, Federal Reserve Chair Jerome Powell claimed rate cuts in 2024 had come into view just two weeks later.
On the transportation side, robust freight volumes outperformed typical December seasonality and remained positive YoY, a good indicator of the early stages of a market recovery. Despite the upside in freight demand, the market remains oversaturated with supply and is getting no help from declining fuel prices. The intermodal sector continues to improve in the face of a losing battle against weak truckload conditions. Although volumes are up for rail carriers, cost inflation and competition with OTR have kept rates and discounts down.
In the maritime sector, U.S. containerized imports registered both monthly and yearly increases in December of 0.4% and 9.2%, respectively. Compared to the same time period in 2019, imported TEU (twenty-foot equivalent units) volumes were up 10.6%. Annualized growth for imported volumes in 2023 came within 4.6% of 2019 but remains 11.7% below 2022 levels.
Main Takeaways
- The manufacturing sector in the U.S. contracted in December but at a slower rate than November.
- The spread between contract and spot rates narrowed as rate increases across the spot market outpaced moderate increases on the contract side.
- Freight volumes outperformed typical seasonality in December and remained elevated compared to the previous year’s levels.
- The carrier population decreased further as net revocations continue at historic rates and new entrants remain in decline.
- U.S. oil production is at its highest level on record as average fuel prices posted a fourth consecutive month of declines.
Economy | Spot Rates | Truckload Demand | Truckload Supply | Fuel Prices | Dry Van Overview | Reefer Overview | Flatbed Overview | Intermodal
Economy
United States ISM Manufacturing PMI
Key Points
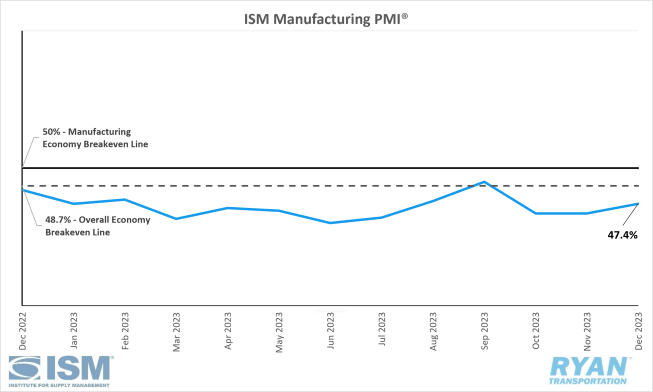
- The ISM Manufacturing PMI® remained in contraction territory at 47.4% in December, a 0.7% increase from November’s reading of 46.7%.
- The New Orders Index contracted further in December, dropping 1.2% from November’s figure of 48.3% to 47.1%.
- The Production Index moved back into expansion territory in December at 50.3%, a 1.8% increase from the 48.5% recorded in November.
- The Employment Index was up 2.3% in December to 48.1% as employment contracted at a slower rate than in November.
- The Customers’ Inventories Index moved back to the low end of “about right” territory in December from the high end in November as the index dropped 2.7% to 48.1%.
Summary
Manufacturing activity in the U.S. contracted for the 14th consecutive month in December but at a slower rate compared to November. In terms of the overall economy, the 47.4% recorded by the ISM Manufacturing PMI® in December marked the third straight month below the overall economy breakeven line of 48.7%. According to the ISM report, companies managed outputs more effectively in December than November as demand levels remain persistently soft.
The demand components of the Manufacturing PMI®, measured by the New Orders, Backlog of Orders and Customers’ Inventories Indices, continued to reflect an easing demand environment. The New Orders Index dropped 1.2% in December as new orders contracted at a faster rate than November. The Backlog of Orders Index jumped significantly by 6.0% to move back above 40% but remain fairly deep in contraction territory. Meanwhile, the Customers’ Inventories Index moved back into contraction territory in December, dropping from "too high" to "too low" compared to “about right” territory. The output/consumption components of the Diffusion Index, measured by the Production and Employment Indices, combined for a 4.1% positive impact on the Manufacturing PMI® calculation in December, according to ISM’s reporting. The Production Index moved back into expansion territory following a 1.8% increase over November’s figure of 48.5%. A 2.3% increase in December edged the Employment Index closer to breakeven territory as the subindex contracted at a slower rate than in November.
The inputs side of the Manufacturing PMI®, measured primarily by the Prices and Supplier Deliveries Indices, continues to accommodate future demand growth. The Supplier Deliveries Index registered a 0.8% increase in December over November, indicating faster deliveries for the 15th consecutive month. Meanwhile, the Prices Index moved further into “decreasing” territory as softness in energy markets was offset by increases in the steel and aluminum markets, according to ISM.
Why it Matters:
The slower rate of contraction in the manufacturing sector in December exceeded expectations, but provided little clarity on the future health of the overall economy. While the demand environment remains soft, there are signals that a rebound could be in store for 2024. Given the persistence of weak demand levels throughout the last year, companies have become more effective in managing production outputs, material inputs and head counts. Of the six biggest manufacturing industries; Computer & Electronic Products; Chemical Products; Transportation Equipment; Food, Beverage & Tobacco Products; Machinery; and Petroleum & Coal Products; none registered growth in December.
New Orders continue to be pulled down by elevated financing costs for many of the capital-focused industries. The Chemical Products industry was the only one of the six largest manufacturing industries to record growth in new orders in December. While a contraction of new orders generally dampens the outlook for future production, the growth in Chemical Products is a positive indicator for the entire manufacturing industry, according to the ISM report. Customer inventory levels in December were also responsible for driving uncertainty in future production levels. Generally, a shift into contraction territory of customers’ inventories adds positive pressure for future production. However, inventory levels remain “just right”, making the impact of moving into contraction territory a neutral one at best.
Macro Impacts
- Nonfarm Payroll employment rose by 216,000 jobs in December, exceeding the expectation of 170,000 and topping November’s revised figure of 173,000 from 199,000 on a seasonally adjusted basis, according to the most recent jobs report released by the Bureau of Labor Statistics (BLS).
- The unemployment rate remained unchanged from November at 3.7%.
- Total Transportation and Warehousing employment declined by 22,600 jobs in December, driven by a drop in Courier and Messenger employment of 32,300 jobs.
- Truck Transportation employment rose by 3,300 jobs.
- Warehousing and Storage employment declined in December, shedding 4,900 jobs.
- The Personal Consumption Expenditures (PCE) Prices Index, the Fed’s preferred gauge for measuring inflation, declined 0.1% MoM in November while core PCE, which excludes food and energy, rose by a seasonally adjusted rate of 0.1%, according to the Bureau of Economic Analysis’ November PCE report.
- Annually, headline PCE was up 2.6% in November, 0.3% less than the 12-month increase in October of 2.9%, seasonally adjusted.
- For the 12-month period ending in November, core PCE rose 3.2%, a 0.2% drop from October’s annual figure of 3.4%.
- Both the headline and core Consumer Price Index (CPI) rose a seasonally adjusted 0.3% in December after both registered a 0.1% increase in November, per the Bureau of Labor Statistics’ reporting in January.
- The All-Items Index rose 3.4% for the 12-month period ending in December, up 0.3% from the 3.1% increase registered in November.
- Core CPI, excluding food and energy, rose 3.9% in December on an annual basis after increasing 4.0% over 12 months in November.
- In its final meeting of the year, the Federal Reserve announced not only the unlikelihood of any future rate hikes but floated the potential for three rate cuts in 2024 to drop the federal funds rate by 75 basis points (bps).
- The Fed Chair, Jerome Powell, noted that future rate hikes are not completely off the table but does not believe further tightening in the current cycle will be required.
- While no timeline was given on when rate cuts would occur, according to the CME FedWatch Tool at the time of this writing, the market consensus projects the probability for rates to remain the same at 95.3% versus a 4.7% probability of a 25 bps cut, bringing the target rate down from its current level of 525-550 to 500-525 at the January meeting.
Industry Overview
December Key Figures (YoY)
| Truck Data Points | YoY Percentage (%) Change |
|---|---|
| DAT Spot Rates (incl. FSC) | -12.5% q |
| Fuel Prices | -15.7% q |
| ACT Class 8 Preliminary Orders | -12.5% q |
| ATA NSA Truck Tonnage* | -1.2% q |
| Cass Freight Index** | -6.1% q |
| Cass Freight Expenditures | -23.7% q |
| Cass Freight Shipments | -7.2% q |
*Report released 12/19/2023
Rates
Spot Rates
Key Points
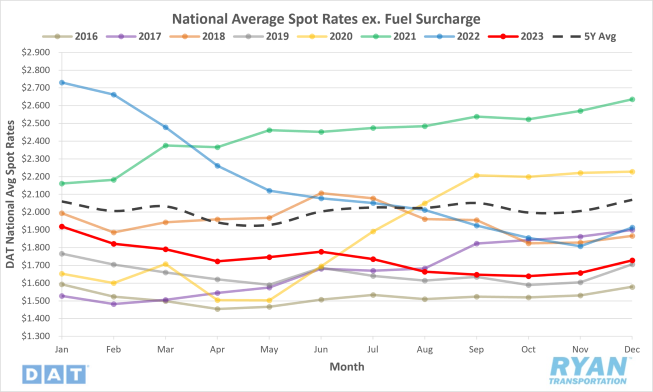
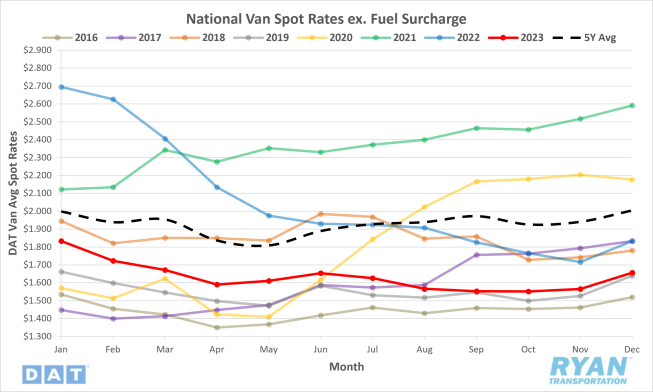
- The national average spot rate excl. fuel surcharge increased 4.3% MoM, or $0.072, in December.
- Linehaul spot rates in December were down 9.6%, or $0.185, compared to the same time last year and sit 16.5% below the 5-year average.
Contract Rates
Key Points
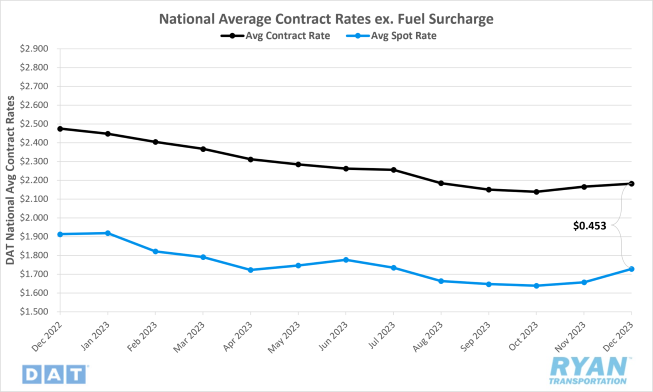
- The national average contract rate excl. fuel surcharge increased 0.8% MoM, or $0.016, in December.
- Compared to the same month last year, contract rates are down 11.8% YoY, or $0.293.
- The contract-to-spot spread narrowed in December, dropping from $0.509 in November to $0.453.
Summary
Trending in line with seasonality, national average spot rates excl. fuel in December registered gains for the second consecutive month. December marked the third sequential month for national average linehaul rates trending in line with seasonality, but they still remain well below long-term averages. As was the case throughout most of 2023, spot rates continue to closely mirror those of 2019, when the industry went through its last recession. Compared to the same time in 2019, average spot rates ended December 1.3% higher in 2023.
Following disruptions stemming from Thanksgiving, the DAT 7-day average linehaul rate registered WoW increases just under 5% in the two weeks following the holiday. The moving average stalled slightly in the second week of the month, dropping 0.8% WoW before gaining 0.7% in the week before Christmas, driven by a $0.19 surge in refrigerated rates. As expected for the last week of the year, the 7-day average linehaul jumped 5.4% as capacity came off the road for the Christmas and New Year’s holidays.
On the contract side, national average rates excl. fuel registered a second consecutive month of gains in December. The 0.8% MoM increase in December was just the second time contract linehaul rates recorded a monthly increase in 2023. Prior to the 1.2% MoM jump in November, contract rates hadn’t registered positive MoM movement since February 2022, when rates increased by 4.9%. The moderate gains observed in the contract market were outpaced by the jump in spot rates, narrowing the contract-to-spot spread to $0.453, its lowest level since April 2022.
Why It Matters:
As mentioned in previous updates, Q4 is riddled with capacity disrupting holidays that generally bode well for both the spot and contract markets from a pricing standpoint. Since volume typically softens following peak truckload season early in the quarter, the reduction in available capacity is primarily responsible for the spike in rates between Thanksgiving and the end of the year. The WoW gains observed in the final week of the year were on par with what was expected during this time. Historically, the week between Christmas and New Year's is responsible for the most significant WoW gains in spot rates each year, even in down markets. Speculation leading up to the week caused some to believe that anything less than average might be the tipping point that forces the remaining excess capacity out of the market.
The moderate gains in contract rates in December came because of positive pressure from increasing spot market rates. With peak truckload season and the major holiday disruptions slated each year during the fourth quarter, shippers operating under shorter term contracts, or “mini bids,” are more exposed to the drastic fluctuations of spot market prices. With the majority of RFP season now in the past and with annual contracts having been renewed, it is likely that contract rates should decline as carriers work to retain market share and stay on routing guides. The decline in the spread between contract and spot rates was a step in the right direction, as the spread remains significantly elevated against pre-pandemic standards. However, it is not likely to continue narrowing in the near future as capacity levels remain elevated, pulling both spot and contract rates down especially through the soft demand environment Q1 is typically known for.
Truckload Demand
Key Points
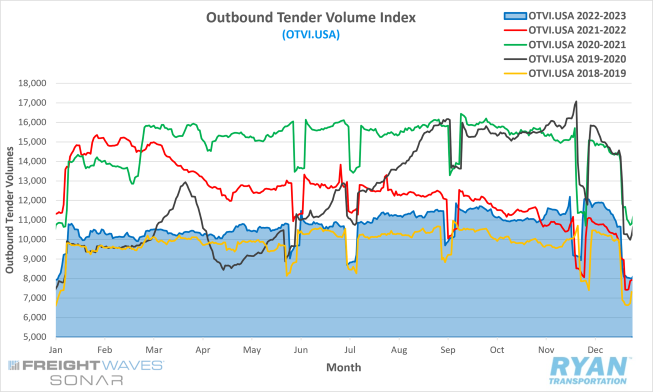
- The FreightWaves SONAR Outbound Tender Volume Index (OTVI.USA), a measure of contracted tender volumes across all modes, ended December down 33.6% from the levels recorded 30 day prior.
- The monthly average of daily tender volumes recorded by the index in December was 0.6% lower than November’s figure, dropping from 10,858.04 to 10,792.03.
- On an annual basis, December’s monthly average of daily tender volumes was up 9.2% and registered 1.9% below the 5-year average.
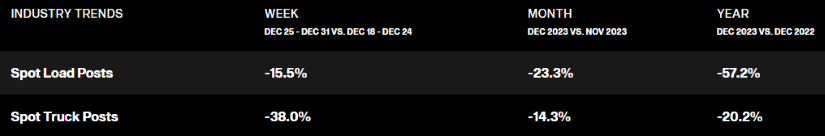
- Spot market volumes continued to deteriorate in December, dropping 23.3% MoM and were 57.2% below the same month in 2022.
- The Cass Freight Index Report, which analyzes the number of freight shipments in North America and the total dollar value spent on those shipments, registered MoM declines of 1.6% and 3.0%, respectively, for shipments and expenditures and annual decreases of 7.2% and 23.7%, respectively.
Summary
Truckload demand in December outperformed typical seasonality for this time of year, when volumes generally take a significant dip following a strong performance in November. Tender volumes, measured by the OTVI, rallied following the traditional lull in activity after the Thanksgiving holiday, jumping 6.5% from the end of November through the first week of December. The elevated demand levels showed stability through the second week before the rally started to lose momentum after the halfway point of the month. In the two weeks leading up to Christmas, volumes trailed off, falling 10.3% before dropping off significantly immediately after, as is typical in the days following every major holiday.
The end of month MoM comparisons for December are skewed as a result of facility closures for the winter holidays. Looking at mid-month comparisons in order to remove the static from the holidays, tender volumes were up 2.7% midway through December from the previous 30 days, which is still uncharacteristic for the last month of the year. When averaged out across the month, the 0.6% MoM decline last month outperformed the average monthly decline between November and December (6.9%) since the inception of the OTVI.
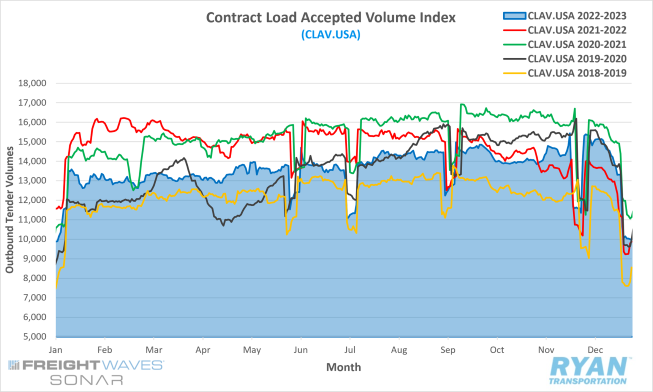
Despite the aforementioned holiday disruptions, the contract market continued to dominate the market share of volumes over the spot market. Historically, spot market volume shares gain momentum towards the back half of Q4 as a result of drivers coming off of the road to spend time at home for the holidays. Even during the onset of the market downturn in 2022, December spot volumes recorded modest MoM gains of just over 5%, which was relatively low at the time compared to pre-pandemic standards. Freight volumes favoring the contract market are further supported by the FreightWaves SONAR Contract Load Accepted Volume Index (CLAV.USA), shown below, which is similar to the OTVI but removes tender rejections. According to readings from the index, tender volumes accepted under contract were up over 29% midway through the month and almost 10% over the same time period in 2022.
Why It Matters:
Though fitting given the nature of the industry over the past three years, the robust start to December in truckload volumes was uncharacteristic for the final month of the year, but not completely unexplainable. The primary culprit stems from the widespread switch by shippers to just-in-time inventory strategies. Many shippers have finally worked through excess inventories, brought on by pandemic-driven demand boom, to achieve a more manageable level. With demand levels steadily declining throughout 2023 and the cost of capital increasing, shippers have reduced future orders and kept essentials on hand to avoid excess inventory.
Another speculation for the unseasonable rise in truckload volumes points to the off timing of typical peak seasons across the transportation industry. The initial catalyst was the maritime peak season, which traditionally runs in September, starting early in August and moving up the timeline for both intermodal and truckload peak seasons. Expected elevated October volumes for rail carriers were pulled forward to September and spread out into October, making the appearance of a peak season nearly non-existent. The truckload sector faced a similar fate with the added twist of just-in-time inventory management, pushing late October volumes out to inflate early November levels.
Freight flowing primarily through the contract market further supports that the current freight recession is capacity driven. Carriers continue to stress the importance of meeting shipper performance metrics in order to retain market share. The YoY increase in accepted volumes recorded by the CLAV indicates freight volumes are recovering from the bottom of the cycle.
Truckload Supply
Key Points
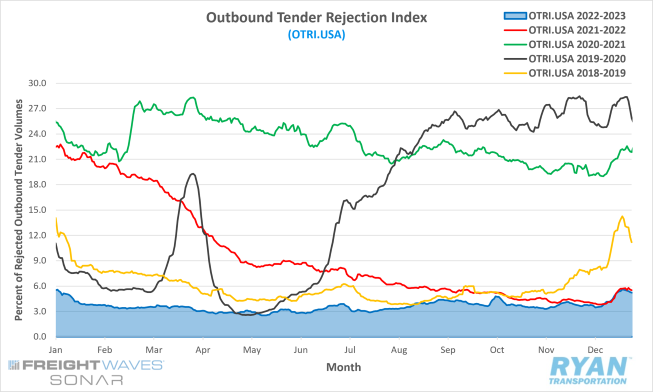
- The FreightWaves SONAR Outbound Tender Rejection Index (OTRI.USA), a measure of relative capacity based on carriers’ willingness to accept freight volumes under contract reflected as a percentage, ended December at 5.24%, a 1.58% increase from the end of November.
- Average daily tender rejections in December registered 4.41% by the index, 0.73% higher than the November’s average of 3.68%.
- Compared to 2022, average daily tender rejections in December were lower by 0.17% and sit 10.7% below the 5-year average.
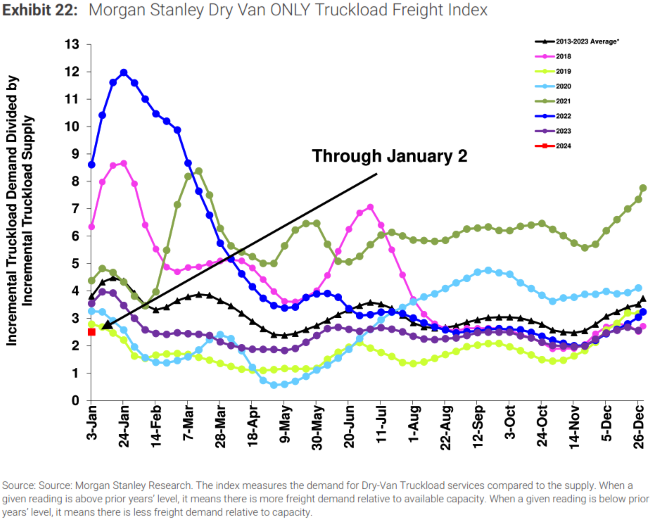
- After increasing sequentially and outperforming typical seasonality in November and the start of December, the Morgan Stanley Truckload Freight Index (MSTLFI) posted sequential declines in the final two weeks of the year and underperformed seasonality.
Summary
December’s data continued to reflect an oversupply of capacity, as both pricing and tender rejection rates remained well below historical averages despite the major holiday disruptions. Following a rally in the days leading up to Thanksgiving that pushed the index north of 4%, rejection rates stalled immediately post-holiday and trended negatively through the first half of December. By the end of the first week, the rejection index had dropped 65 bps from its November peak (the day before Thanksgiving) to 3.48%. Tender rejections stabilized by the second week but remained below 4% and left the average in the first half of December at just 3.68%. Heading into the final weeks before Christmas, rejection rates rallied, surpassing 5% for the first time since January 9, 2023 before ultimately reaching their year-to-date peak on Christmas Day at 5.6%. Prior to its holiday peak, the previous high recorded by the index in 2023 occurred on January 2.
From an annual comparison, December’s tender rejection levels largely underperformed the muted 2022 holiday shipping season. In all but seven days (during the week before Christmas), YoY comparisons of daily rejection rates were negative in December. Based on the index’s readings, both the monthly average of daily rejection rates and peak in December registered 0.17% below the previous year’s levels, making 2023 the softest holiday shipping season on record. This is further supported by December’s readings from the Morgan Stanley Truckload Freight Index, as current levels remain below the previous year and long-term averages.
Why It Matters:
Understanding and utilizing the OTRI during the month of December is key for analyzing the capacity situation heading into the new year. Rejection rates are one of the best sources for gauging market conditions when comparing current levels against the past. Volume levels traditionally dip in the last month of the year but are subject to drastic swings from consumer behavior, most notably observed during the pandemic. Prices are also volatile during the year’s final months from a combination of direct-to-spot market freight as well as being impacted by inflation, making YoY comparisons less reliable.
Traditional capacity disruptions during Christmas and New Year’s alone are typically enough to influence a higher spike across spot market pricing than what was observed in December. Those disruptions, paired with the resiliency of demand during the final month of the year, would have translated into more volumes moving over to the spot market and resulted in a significant breakdown in shippers’ routing guides. As mentioned in our previous updates, OTRI values generally need to be in the range of 5-7% before major carriers begin to notice disruptions across their networks. With volumes turning positive YoY, the market is in the early stages of recovering but as average rejection rates remain below 4%, there is still an excess of supply to bleed off before the balance can be restored.
Truckload Capacity Outlook
Key Points
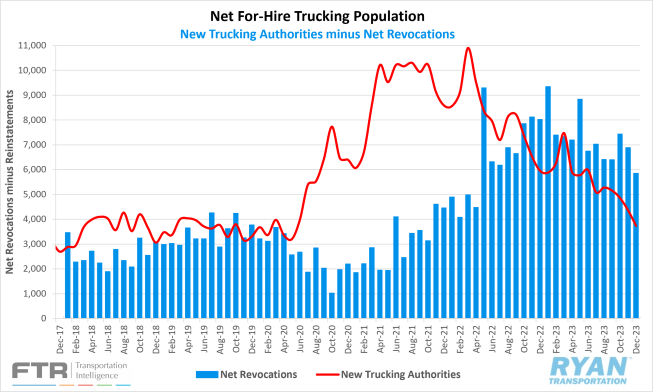
- Total net revocations, a measure of total authority revocations minus the number of reinstatements, fell in December, dropping from 6,886 carriers in November to 5,852 carriers, according to FTR’s preliminary analysis of the Federal Motor Carrier Safety Administration’s (FMCSA) data.
- The number of newly authorized for-hire trucking companies also declined, down from 4,367 new setups in November to 3,741 new authorities and its lowest figure since May 2020.
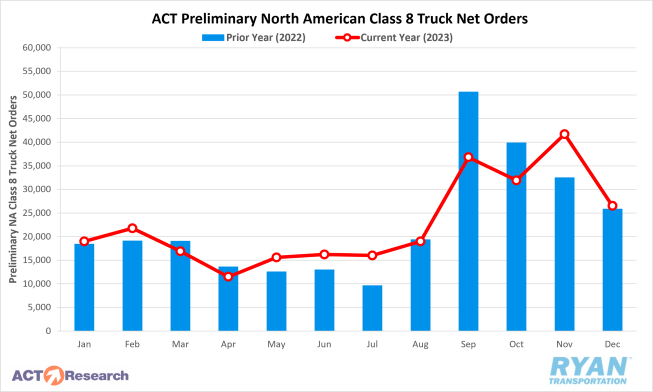
- Depending on the source, preliminary North American Class 8 orders estimates ranged from 26,500 units, per ACT Research’s reporting, to 26,620 units, according to FTR’s analysis, and down annually by 13% and 7%, respectively.
Summary
The for-hire trucking population continued to decline at a record pace in December, though at a slower rate than November, with the net decrease falling from 2,519 carriers to 2,111 carriers. While the monthly declines in the carrier population have slowed since October, from a quarterly perspective, Q4 recorded the highest ever net decrease in trucking companies at just over 7,200 carriers. Much of the slowdown in the declining carrier population since October stems from a decrease in MoM net revocations. Revoked authorities in November were nearly 550 less than October, while December’s figure came in over 1,000 below the preceding month. Despite these declines, revocations still remain significantly elevated compared to pre-pandemic averages. According to FTR’s report, December’s figure was well above the monthly average in 2019, during the industry’s last recession, of 3,400 net revocations, which was the highest on record at the time. Compared to 2018, the last normal year for truckload markets, the monthly average in net revocations was just 2,600 carriers.
New entrants into the market also continued to fall in December, as the number of new authorizations issued by the FMCSA was roughly 630 less than November. Since the start of the quarter, new entrants have fallen by just over 1,400 carriers to their lowest point since May 2020. Despite the recent decline in new entrants, December’s figure is still elevated from a historical standpoint, barely eclipsing the 2019 monthly average of just over 3,600 carriers, according to FTR’s report.
Preliminary North American Class 8 net orders registered between 26,500 units, reported by ACT Research, and 26,620 units, per FTR’s estimate. According to ACT Research, December’s Class 8 orders came in roughly 37% below, or just over 15,000 units less than November’s figure. Per ACT’s estimate, December’s figure puts full-year 2023 net orders at 278,500 units and down 7% from 2022. FTR’s analysis for December came in slightly higher at 26,620 units and down 26% MoM compared to November. According to FTR, the December estimate puts the full-year order number at 253,000 units and down 16% from 2022. When annualizing orders from the last 6 months of the year, the full-year unit count increases to 302,000, with the annualized rate over the last three months of 2023 putting the full-year order count at 362,000 per FTR’s report. Heading into 2024, the backlog order count sits right around 180,000 units left to be built.
Why It Matters:
The record setting declines in the carrier population throughout 2023 and volumes slowly stabilizing in the second half of the year have not gotten the truckload market out of the woods just yet. Though the gap appears to be narrowing, there remains a significant imbalance of truckload supply compared to demand, and with capacity taking longer than expected to bleed off. Since it is evident that the current freight industry recession is capacity driven, the timeline for a market recovery is still unclear.
One of the more surprising data points from December was the magnitude of the decline in net revocations from the previous month. FTR speculates the combined impacts of falling diesel prices, paired with stabilizing volumes and spot rates, could be limiting carrier failures and allowing others to continue operating. There is also the potential for November’s numbers to be artificially inflated, due to the FMCSA’s regulatory enforcement of rooting out fraudulent “blanket companies” offering legal representation in every state, as discussed in our December 2023 Industry Update.
Despite the conditions of the current freight recession, with no clear timeline for a recovery in sight, new truck orders continue to perform better than expected. Although the backlog order of 180,000 units puts the industry in a good position heading into 2024, the tractor market is overcapitalized currently, so a slowdown in ordering activity will be inevitable over the next year. According to ACT research, some of 2023’s figures were inflated from clearing backlogs from pent-up demand that started in 2021, as well as 2024 orders being pulled forward to meet California’s zero-emission truck rule that is set to begin this month. Further analysis of stronger-than-expected numbers in 2023 points towards the revival of Mexico’s economy as a result of nearshoring and vocational truck orders, primarily needed in the commercial construction and oil production sectors.
Fuel Prices
Key Points
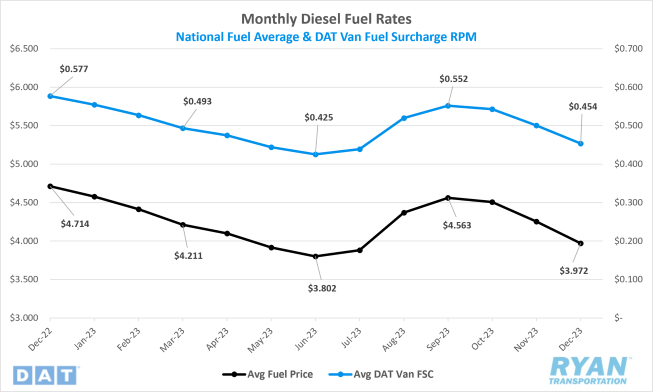
- The national average price of fuel declined for the third straight month, dropping 6.6% MoM, or $0.282, in December.
- At $3.972, the average price of diesel is down 15.7%, or $0.742, compared to December 2022 levels.
- Draws on U.S. crude reserves outpaced builds for the first time since October, with the net change in commercial crude stocks decreasing by 12.6M barrels (bbls) versus the consensus of 9.9M bbls for the weeks ending December 8th and January 5th, according to reports released by the Energy Information Administration (EIA).
Summary
The average price of fuel declined further in December, dropping for a fourth straight month as global supply levels continue to outpace demand. After a late summer rally stalled towards the end of October, average diesel prices fell $0.651 over the next eight consecutive weeks before registering a slight increase in the final week of the year.
The slight increase in the last week of the year came on the heels of geopolitical tensions surrounding major trade lanes for global oil. Terrorist attacks targeting commercial ships in the Red Sea and Suez Canal by Houthi rebels out of Yemen sparked concerns of impacts to supply levels in mid-December. Prior to the attacks, Brent Crude closed at its lowest level since its June 27 level of $73.24 per barrel before surging immediately, following to eclipse $80 per barrel for the first time since November 30. Much of the concern regarding supply stemmed from the possibility of rerouting ships around South Africa’s Cape of Good Hope, tying up oil supplies for an additional seven to twelve days on the water.
Uncertainties surrounding global supply quickly returned to their pre-attack levels thanks in large part to continued record production levels from the U.S. According to the International Energy Agency, the U.S. accounted for 80% of the global expansion in 2023 with Texas’ and New Mexico’s Permian regions driving the growth. In November, the U.S. produced an average of just over 13M bbls per day, with some analysts projecting that average topping 15M bbls per day in 2024.
Why It Matters:
Oversupply in the global oil markets appears to be here to stay, at least through the first few months of 2024, according to a number of analysts within the industry. In a recent survey, a number of major U.S. firms slated increased production levels as the top goal heading into 2024, followed by acquisitions and taking care of shareholders. The recent sentiment is the complete opposite of fiscal responsibility pledges from multiple oil and gas executives in recent months, amidst disagreements with the current administration’s focus on shifting towards greener energy sources.
Much of the reversal in priorities could be an opportunity to seize market share from OPEC+, while fractions amongst member nations over production levels continue to weaken confidence in the oil cartels’ pricing power. In its end-of-year meeting, OPEC+ revealed its pricing formula based on differentials to benchmarks in various regions reflected a widening of discounts compared to other global sources. The discount on Saudi crude prices could be seen as an aggressive strategy to retain market share it gave up in 2023, or a true reflection of weakening demand in response to the significant production cuts.
Other reports indicate the increase in production levels has been primarily driven by smaller, privately owned companies seeking to increase attraction to investors. Regardless of the cause, the excess in supply in the early part of 2024 should continue to keep the retail costs of fuel trending lower in the near-term. Zooming out further, falling energy prices should remove the threat of energy-fueled inflation that kick started the current cycle in February 2022 and help the economy navigate towards a soft landing.
Dry Van Overview
Dry Van Spot Rates
Key Points
- The national average dry van spot rate excl. fuel increased 5.8% MoM, or $0.091, in December.
- Compared to 2022, dry van linehaul rates were down 9.6%, or $0.17,6 and sit 17.4% below the 5-year average.
- Average dry van contract rates excl. fuel registered 0.8% growth in December but remain 15.3% below the same month in 2022.
Dry Van Load-to-Truck Ratio
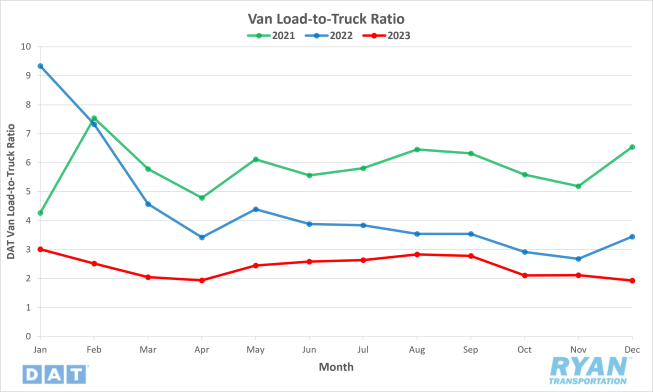
Key Points
- The dry van load to truck ratio (LTR) fell 9.0% in December and was 44.1% below December 2022 levels.
Dry Van Market Conditions
Dry Van Summary
The dry van market is experiencing fluctuations influenced by fuel prices, seasonal trends and shifts in import volumes. Despite the American Trucking Association’s (ATA) For-Hire Truck Tonnage Index increasing 1.1% in October, many experts are pointing to a softening in the contract freight market. The index remains 3% below its recent peak in September 2022, has seen an eighth straight YoY decline and is dominated by contract freight, as the latest data from DAT’s contract shippers indicate around 15% of all loads are moving on the spot market. According to Dr. Zac Rogers of Colorado State University, capacity is clearly migrating to where the freight is and, “is being added in a smart and targeted way to where demand is. This includes final-mile delivery or delivery between distribution centers and retail stores.”
IHS Market/PIERS import data for November reports a 9% MoM volume decline. West Coast volumes are returning and impacting East and Gulf Coast ports. Led by an 18% MoM decline in New York, the East Coast volumes dropped 12% in November. The Gulf Coast is increasingly impacted by the ongoing drought in the Panama Canal, with a 24% plunge in volumes in November. Houston, the largest importer, reported 15% lower import volumes. National volumes totaled 2,131,187 TEUs in November, approximately 6% higher than 2022 and 5% higher than the November monthly average over the eight years prior.
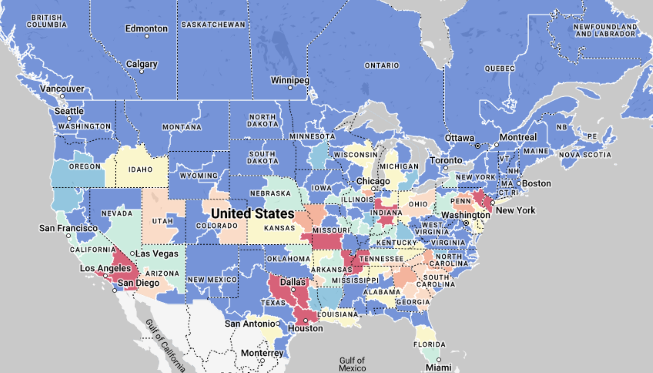
In the first week of December, dry van spot rates increased in all lower 48 states except for Wyoming. Despite the $0.09 increase throughout the month, spot rates are 9.6% below December 2022 and 17.4% below the 5-year average. Contract rates also saw a marginal increase of 0.8% for the month but remain 15.3% below 2022 levels. In comparison to the recessionary freight periods of 2016 and 2019, dry van linehaul rates this year decreased by $0.17/mile from last year. Historically, during the same periods in 2016 and 2019, rates increased $0.10/mile from mid-December to the end of the year.
The dry van load-to-truck ratio (LTR) fell throughout the month and sits 44% below last year. After the post-Thanksgiving spike, the market followed seasonal patterns with volume sitting around 65% of what it was in 2022. High levels of routing guide compliance in the contract market have led to fewer loads entering the spot market compared to previous years. Carrier equipment posts are tracking identically to pre-pandemic years, indicating a return to normalcy in capacity dynamics.
Reefer Overview
Spot Rates
Key Points
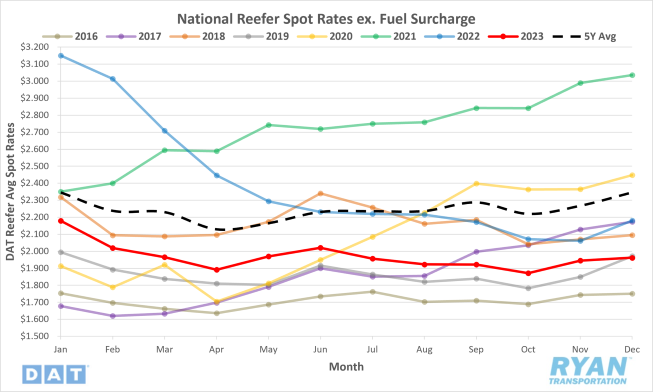
- The national average reefer spot rate excl. fuel was up slightly MoM in December, increasing 0.9%, or $0.017, from November.
- Average reefer linehaul rates were 10.0% below 2022 levels and sit 16.4% below the 5-year average.
- Reefer contract rates excl. fuel were down 0.4% MoM in December and sit 11.6% below the previous year’s levels.
Reefer Load-to-Truck Ratio
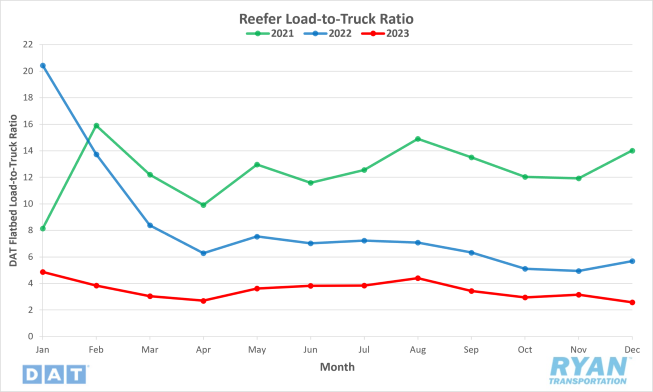
Key Points
- The reefer LTR in December fell 18.4% MoM and sits 54.7% below the same time in 2022.
Reefer Market Conditions
Reefer Summary
The Southern border of the United States is playing a significant role in the reefer market, possibly affecting rates and capacity in other areas of the country. The McAllen market is a busy hub for reefer carriers. The Pharr-Reynosa International Bridge facilitates international commercial traffic, with 10% of the U.S .- Mexico truck traffic passing through it. It is significant for produce carriers, representing 43% of imported produce truckload volume. The top imported commodities include tomatoes (14%), avocados (13%) and limes (11%). With Christmas and New Year’s during this time of year, as well as the Super Bowl taking place in Las Vegas, there is an expected increase in produce volumes into the Tucson market. Winter also sees a paradoxical peak in citrus, including oranges, grapefruit, tangerines, clementines, lemons and limes. California and Florida dominate citrus production, with 94% of production occurring in November. Mexico accounts for 18% of annual citrus volume, with the Pharr, Texas crossing handling 71% of Mexican imports. The 2023 harvest season in California experienced delays due to a tropical storm. While harvest volumes are higher than 2022, they are lower than 2021. Pest issues, particularly citrus thrips, have been a major concern for growers. California’s Imperial Valley, along with Yuma, AZ, known as the Winter Salad Bowl, are significant hubs for reefer carriers. They produce 90% of leafy greens from November through March. According to USDA data, there has been a slight decrease in shipped lettuce volume compared to 2022, and regional reefer volume remains relatively loose with plenty of surplus available capacity.
Reefer spot rates did not see the same gains as dry van, with only about a $0.02 cent increase compared to November. There were pockets of tightness during the month. The Midwest, known as the “meat patch,” saw spikes in outbound reefer rates in Oklahoma and Kansas. The Pacific Northwest faced tightening capacity with a shortage reported for Christmas trees and winter produce. McAllen, Texas was the only market to report a surplus of reefer trucks. Be prepared for the Southwest produce season, reefer capacity is expected to tighten and could lead to potential linehaul increases of up to $0.50/mile. Miami rates are tightening slightly due to carrier’s reluctance to head deep into Florida. Rates from Miami to Atlanta were $0.85/mile, but carriers are pushing for higher rates in the opposite direction, reaching an average of $2.56/mile in the third week of December. Compared to the recessionary periods of 2016 and 2019, reefer linehaul rates typically increase by $0.20/mile from mid-December to the end of the year. This year’s spot market trends closely with 2019, showing a $0.06/mile decrease during the three weeks after Thanksgiving.
The reefer LTR fell 18.4% MoM and sits 54.7% below 2022 levels. In the first 5-day shipping week after Thanksgiving, reefer load post volume more than doubled compared to previous years. However, the following weeks saw a 38% decrease in volume. The USDA attributes the decline to lower Fall produce volumes, particularly in California, where volumes were 39% lower than 2022. Overall, the reefer market is navigating through a complex interplay of regional demands, seasonal variations and external factors.
Flatbed Overview
Spot Rates
Key Points
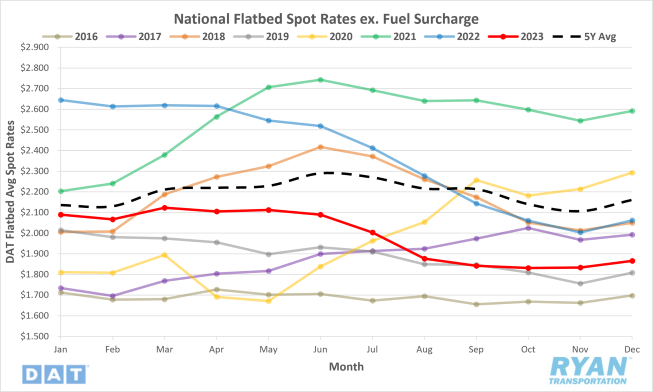
- The national average flatbed spot rate excl. fuel increased 1.7% MoM, or $0.031, in December.
- Average flatbed linehaul spot rates were down 9.5% compared to December 2022 and sit 13.7% below the 5-year average.
- The average flatbed contract rate excl. fuel increased 0.8% MoM but were still below the previous years level by 8.9%.
Flatbed Load-to-Truck Ratio
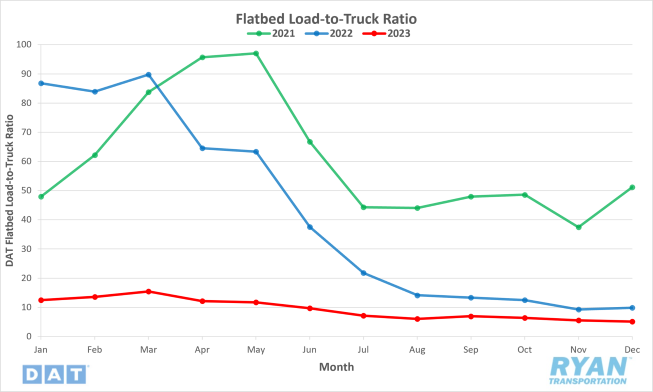
Key Points
- The flatbed LTR fell 7.1% in December and was 47.9% below December 2022 levels.
Flatbed Market Conditions
Flatbed Summary
The flatbed market is seeing capacity needs from many different sectors and regions of North America. Farm tractor and combine sales align closely with the 5-year average, with heavy-duty 4WD tractor sales showing significant 12.6% YoY and 36% YTD increases. Canada showed growth in tractor sales up 4.6% YTD, however, combines were down, falling 16.1%. The 2024 residential construction outlook appears gloomy, impacting many flatbed carriers based on the sentiment of NAHB members, registering a 34 in November, the lowest level since the end of last year. Doug Duncan, Fannie Mae Senior Vice President and Chief Economist, said, “The combination of persistent affordability challenges and less rosy household finances remain the primary drivers of the low-level plateauing of housing sentiment. Even if mortgage rates decline over the next year, which we currently expect, it’s unlikely to affect affordability meaningfully. The lack of housing inventory will likely remain a challenge, and home purchase sentiment may continue to be suppressed. As our forecast indicates, we believe it will be a couple of years before home sales return to more normal, pre-pandemic levels.” The flatbed market faces challenges due to this gloomy outlook for residential construction and low housing inventory.
Flatbed spot rates saw a slight increase in December of $0.03 but remained 9.5% below the same time last year and 13.7% below the 5-year average. Some contributing factors to the slight increase could be national domestic steel production was up 7.1% compared to 2022, according to the American Iron and Steel Institute. This impacts flatbed carriers in the steel markets of Gary and South Bend, Ind., where around 30% of domestic steel is produced annually. The overall market is still oversupplied with capacity impacting spot rates. They are 6% lower than last year. Houston to Lubbock, one of the busiest flatbed lanes in the country, paid carriers $2.18/mile in early December, the lowest in 12 months and almost $0.60/mile lower than last year. In the Southeast, around 65% of the nation's new single-family homes are started each month and 45% of raw steel is produced. This contributes to a quarter of the weekly spot market volume for flatbed carriers. With excess capacity in the market, regional linehaul rates are 5% lower than last year, but have increased by the same amount in the last month. Compared to 2019, rates are just $0.13/mile higher.
The flatbed LTR fell 7.1% in December and is 47.9% below the 5-year average. Load posts more than doubled in DAT’s system the first week of December but remained 35% lower than last year and around half the weekly volume reported in 2019. Load posts decreased by 25% the following week and then an additional 2% decrease following seasonal trends. Compared to the prior two freight recessions in 2016 and 2019, like the reefer and dry van sectors, this year’s spot market is tracking closest to 2019, mainly flat during November before starting the year-end climb as capacity tightens.
Intermodal
Spot Rates
Key Points
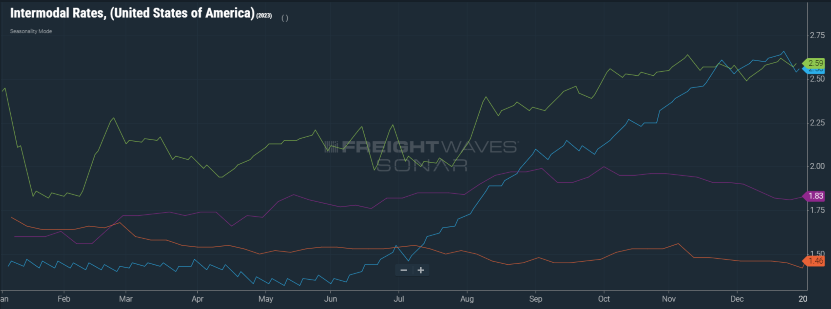
- The FreightWaves SONAR Intermodal Rates Index (INTRM.USA), which measures the average weekly all-in, door-to-door intermodal spot rate for 53’ dry vans across a majority of origin-destination pairings, declined by $0.01 MoM to $1.68 in December.
- Compared to December 2022 levels, intermodal spot rates were down 35.1% YoY and sit 16.5% below the 5-year average.
Intermodal Volumes
Key Points
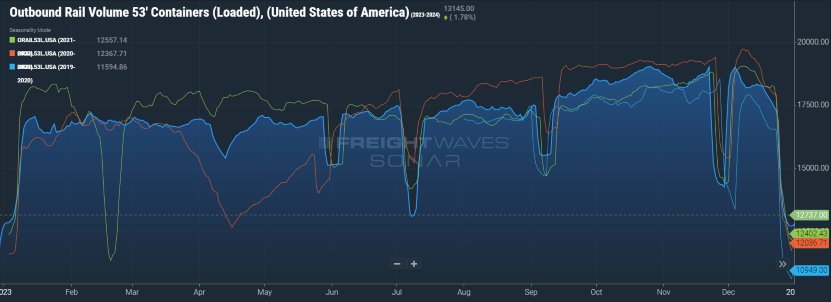
- Total loaded volumes for 53’ containers from all domestic markets, measured by the FreightWaves SONAR Loaded Outbound Rail Volume Index (ORAIL53L.USA), fell 22.8% MoM in December.
- Despite significant MoM declines, loaded outbound volumes on the rail were relatively flat compared to December 2022 and are 3.7% above the 5-year average.
Intermodal Summary
December is generally not pegged as a noteworthy time for the intermodal sector, being just a few months removed from its traditional peak season. Much of the focus during the last month of the year falls on maintaining service levels and market share while navigating around weather and holiday disruptions. While this past December was inline with seasonality for rail carriers, given the numerous headwinds the industry has faced over the last two years, it can’t help but feel like a step in the right direction.
Despite the competitive landscape within the truckload industry, the intermodal sector saw improvements across multiple areas through the end of the year, setting up a more favorable outlook heading into the new year. One major area of gains for the industry was in overall volumes in the final few months of 2023. While loaded volumes were essentially flat YoY in December, they reached their highest level of the year on a quarterly basis in Q4. Compared to Q4 2022, domestic containerized volumes were up 4.7% YoY after being negative in through the first three quarters of 2023. The uptick in volumes late in the year moved the 2024 volume outlook from a 0.1% decline to a 0.5% increase, according to FTR.
Service levels were another major area of improvement across the intermodal sector, having normalized near historical averages over the last few months. Velocity levels have increased to a greater extent than what seasonality would suggest, indicating carriers are continuing to find ways outside of rates to regain lost market share.
Based on volume forecasts for 2024, early sentiment would indicate that intermodal rates have reached their bottom. However, given the continued competitive environment that truckload presents, this may not completely be the case. According to the FreightWaves SONAR Intermodal Contract Savings Index (IMCSI1.USA), which measures the discount that intermodal presents compared to dry vans, savings via the rail are still not enough to entice customers to move back from OTR as the index recorded its lowest point of 6.73% since its inception, on the last day of the year. The discount provided by intermodal carriers has been in a free fall since the start of November, dropping below the previous YTD low on December 10 and continuing its descent through the end of the year. This lack of savings could inhibit growth in 2024 if truckload conditions do not improve, making 2025 a more realistic forecast before signs of a return to growth begin to show.