
Executive Summary
The outlook of uncertainty continued its several-month trend in May for both the overall economy and transportation industry. Both can be characterized by a sense of cautious optimism, as the data in May provided positive indicators that nonetheless remain shadowed in doubt.
In the overall economy, key industrial indicators were mostly flat or weaker in April compared to March, while manufacturing activity in the U.S. remained in contraction for the second consecutive month in May. The second release of GDP data for the first quarter reduced growth in total output from a weak 1.6% to an even weaker 1.3%. However, the reduction in growth of total output in the most recent release was a result of a decline in inventory accumulation and a large surge of imports, both of which bode well for the transportation industry. The Fed softened on talks of future interest rate cuts, keeping the target funds rate at its current level and reducing the potential for multiple cuts through the end of the year down to the possibility of just one. Finally, the establishment survey of the labor market reflected a growth in payroll employment of 272,000, while the household survey reflected a decline of 408,000 jobs with the unemployment rate ticking up to its highest level since late 2021 at 4.0%.
Across the transportation industry, the conditions appeared less negative than in previous months but not positive enough to indicate a changing of the tides. Over-the-road carriers benefitted from a number of capacity disruptions amidst an increase in summer shipping volumes to gain a little breathing room in freight rates. For-hire capacity exits up to this point has allowed for the return of seasonal factors influencing rates to an extent but remains muted from a historical standpoint. The outlook for truckload carriers remains bleak through the rest of the year as private fleet expansion delays the recovery in for-hire rates, and weakness in domestic manufacturing limits overall demand growth.
Main Takeaways
- Economy: Manufacturing activity in the U.S. contracted for a second consecutive month, as softening demand dropped new orders to their lowest level since May 2023.
- Truckload Rates: Multiple capacity disruptions caused average spot rates to surge, while contract rates continued to decline but at a slower pace.
- Truckload Demand: Freight volumes rose significantly in May on the backs of peak produce and summer beverage shipping ahead of Memorial Day.
- Truckload Supply: Although International Roadcheck and Memorial Day led to a short-term tightening of capacity, excess supply continues to keep conditions depressed.
- Truckload Capacity Outlook: The carrier population continued its decline but at a much slower pace, as net revocations decrease and new entrants recover from 2023 lows.
- Fuel: Average diesel prices extended its streak of declines that began in April driven by falling crude prices, increased renewable diesel production and weak global demand.
- OTR By Mode
- Dry Van: Increases in summer shipping volumes and capacity disruptions caused rates to increase for the first time in four months, but the near-term outlook remains weak as result of excess capacity.
- Reefer: Driven by a strong spring harvest season, refrigerated conditions improved the most of the three major modes in May.
- Flatbed: Regional pockets of increased demand and tight capacity benefitted some flatbed carriers in May, but overall conditions declined as industrial and manufacturing output remained weak over the last two months.
- Intermodal: Despite increasing volumes in the intermodal market, competition with softening truckload conditions continues to depress both spot and contract rates across the sector.
Industry Overview
May Key Figures (YoY)
| Truck Data Points | YoY% Change |
| DAT Spot Rates (incl. FSC) | -2.3% q |
| Fuel Prices | -2.4% q |
| ACT Class 8 Preliminary Orders | 49.7% p |
| ATA NSA Truck Tonnage* | 2.9% p |
| Cass Freight Index | -1.8% q |
| Cass Freight Expenditures | -9.0% q |
| Cass Freight Shipments | -5.8% q |
*Report released 5/21/24
Economy
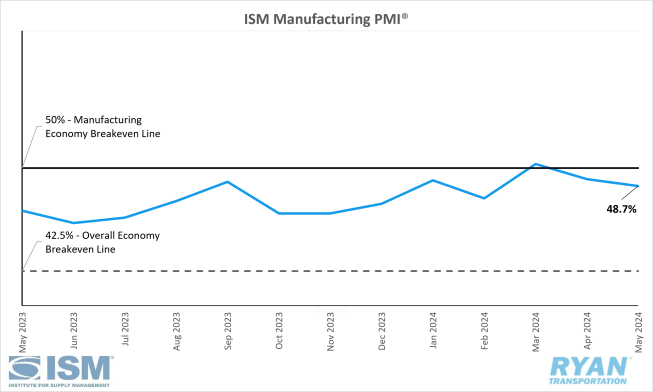
United States ISM Manufacturing PMI
Key Points
- The ISM Manufacturing PMI® registered 48.7% in May, 0.5% lower than the 49.2% reading in April, and remained in contraction territory.
- The New Orders Index moved further into contraction in May, dropping 3.7% from the 49.1% recorded in April to 45.4%.
- The Production Index registered 50.2% in May, 1.1% lower than April’s reading of 51.3%, and remained in expansion.
- The Employment Index was up 2.5% from April’s reading of 48.6% to 51.1% in May.
- The Prices Index registered 57% in May, a 3.9% drop from the 60.9% reading recorded in April.
Summary
The U.S. Manufacturing sector remained in contraction for the second consecutive month after registering growth in March, the first time the industry had expanded since September 2022. The move deeper into contraction territory was driven by the continued softening of demand, as output levels remained stable, and inputs remained accommodative. With relation to the overall economy, May marked 49 months of continued expansion following one month of contraction in April 2020, as the index remained above the 42.5% breakeven point.
The slowing of demand in May can primarily be attributed to the New Orders Index dropping deeper into contraction for the second consecutive month to its lowest reading since May 2023 (42.9%). According to the most recent ISM report, panelists’ survey responses included additional comments of softening compared to previous months. The decline in new orders caused the Backlog of Orders Index to move deeper into contraction, as new order rates were insufficient to allow backlogs to grow. Meanwhile, the Customers’ Inventories Index registered 0.5% higher in May compared to April as the index moved upward to “about right” territory. Per Timothy Fiore, Chair of the Institute for Supply Management® Manufacturing Business Survey Committee, panelists reported customer inventories have sufficient amounts of their products, which is considered neutral for future new orders and production.
The output components, measured by the Production and Employment Indices, combined for a 1.4% upward impact on the Manufacturing PMI® calculation, according to the ISM report. Production execution continued to expand in May but eased slightly compared to April, as companies maintained production levels month-over-month. The Production Index has been in expansion territory in four of the last five months. Meanwhile, the Employment Index returned to expansion territory following seven consecutive months of contraction. Companies continued to manage headcount reductions through layoffs, attrition and hiring freezes, with layoffs accounting for 38% of reduction activity, down from 50% from April. According to the ISM report, hiring and reduction activity was approximately a 1:1 ratio in May, consistent with activity from November 2023 through March.
Inputs, primarily measured by supplier deliveries, prices and inventories, continued to accommodate future demand growth in May. The Supplier Deliveries Index remained stable in May from April, as suppliers continued to have capacity, with lead times improving and shortages not registering as severe. Manufacturing inventories contracted at a slightly faster rate in May compared to April as companies remained cautious with inventory investment due to demand uncertainty. The Prices Index remained in strong expansion territory, or “increasing”, in May, but eased slightly compared to April. Commodities such as fuel, natural gas aluminum and plastics all continued to increase, with some offset coming from steel showing signs of weakening.
Why it Matters:
The ISM Manufacturing PMI® report in May was sobering for the near-term outlook across the sector in the U.S. Although the report was not all negative, the second consecutive month of contraction snuffed out any hope of the start of a growth cycle following the expansion recorded in March. As Fiore noted in last month’s report, there would be bumps along the way on the road to recovery. However, unless demand shows signs of rebounding and the Federal Reserve provides more clarity on future monetary policy, there are not a lot of indications of smooth sailing in the coming months.
The continued softening of demand in May, especially with the New Orders Index falling to its lowest level since May 2023, creates further negative implications across the sector. While production levels have remained resilient amidst slow demand, Fiore notes that much of that stems from companies working off order backlogs from the Covid-19 pandemic over-ordering. Those backlogs are nearly cleared out, however, as evidenced by the Backlog of Orders Index remaining deep in contraction territory. With new orders struggling to gain momentum, production output will have to go down. A drop in production would mean a decline in revenue, which would lead to more significant issues further down the road.
Elevated interest rates and uncertainty surrounding how long they will remain high has become a major headwind for the U.S. manufacturing sector. According to Fiore, the lack of monetary easing has kept companies and their customers reluctant to make any commitments until they see some action. Those commitments include investments in orders, inventory and capital expenditures. In the ISM Semiannual Economic Forecast survey released last month, respondents expected capital expenditures to rise just 1.0% in 2024, a sharp decline from the 11.9% expectations reported in December’s survey.
Of the six biggest manufacturing industries; Chemical Products; Transportation Equipment; Food, Beverage & Tobacco Products; Computer & Electronic Products; Machinery and Fabricated Metal Products; just two (Fabricated Metal Products and Chemical Products) registered growth in May.
Macro Economy
- Following downward revisions to both March and April estimates, nonfarm payroll rose by 272,000 jobs in May for the second highest MoM increase registered in 2024, according to the most recent jobs report from the Bureau of Labor Services (BLS).
- The unemployment rate rose 0.1% from April’s figure of 3.9% to 4.0% in May, the highest it has been since January 2022.
- Total Transportation and Warehousing employment rose by 10,600 jobs in May on a seasonally adjusted basis.
- Truck Transportation declined by 5,400 jobs on a seasonally adjusted basis following downward revisions to April’s figures.
- Warehousing and Storage employment rose slightly by 700 jobs in May.
- The Personal Consumption Expenditures (PCE) Prices Index, the Fed’s preferred gauge for measuring inflation, registered MoM increases in April on a seasonally adjusted basis for both headline and core PCE by 0.3% and 0.2%, respectively, according to the most recent report from the Bureau of Economic Analysis (BEA).
- On an annual basis, the all-items PCE Price Index rose 2.7% seasonally adjusted in April and remained unchanged from March.
- Excluding food and energy, the PCE Price Index was unchanged from March and February, registering a 2.8% increase on a 12-month seasonally adjusted basis.
Truckload Rates
Spot Rates
Key Points
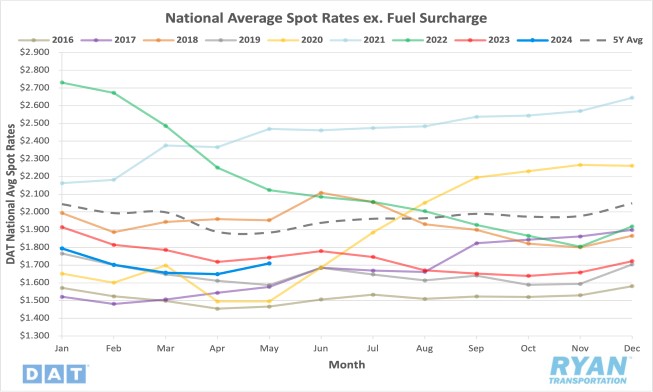
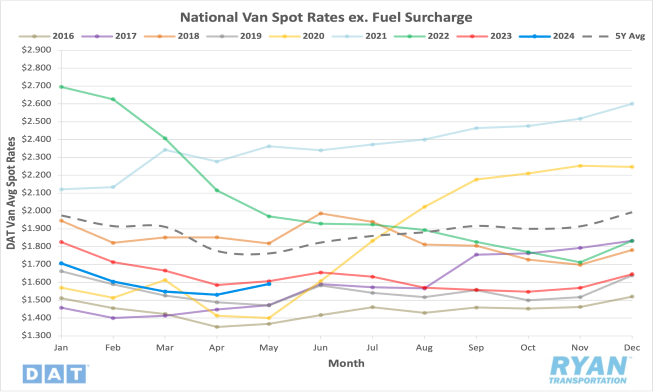
- The national average spot rate excluding fuel increased 3.6% MoM, or $0.059, in May.
- Compared to May 2023, average spot linehaul rates were 2.0% lower, or $0.044, and sit 9.3% below the 5-year average.
Contract Rates
Key Points
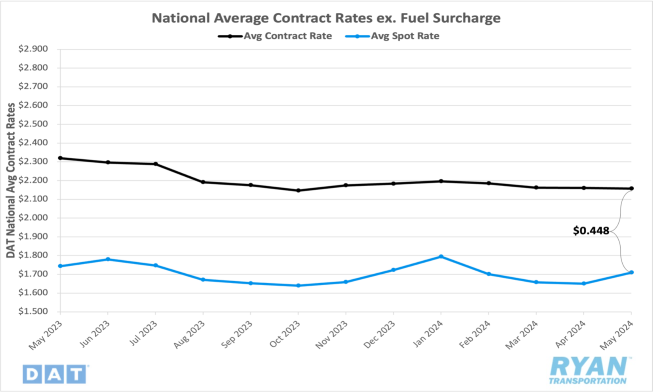
- The initially reported average contract rate not inclusive of fuel were virtually unchanged in May from April, falling 0.1% MoM, or $0.003.
- On an annual basis, average contract linehaul rates was down 7.0% YoY in May.
- Following downward revisions to April’s initially reported contract rates, the contract-to-spot spread declined in May, dropping from $0.510 to $0.448.
Summary
Following the relative stability in April, average spot rates surged in May, outperforming typical seasonality for the second consecutive month. Historically, spot linehaul rates on average remain virtually unchanged MoM between April and May, with the pre-pandemic average reflecting a 0.4% decline, both well below the 3.6% registered last month. When fuel is included, all-in spot rates registered just below a 1% increase MoM in May which also tops the seasonal average increase of 0.4% and the pre-pandemic average increase of 0.5% MoM.
The jump in rates in May feels fitting, given the number of capacity disruptions that occurred throughout the month. After opening the month with just under a $0.02 WoW increase, the DAT 7-day average linehaul spot rate index spiked $0.07 WoW in the second week ahead of the start of the Commercial Vehicle Safety Alliance (CVSA) International Roadcheck. Capacity remained under pressure in the third week, ahead of Memorial Day weekend, resulting in the index registering another surge of just over $0.07 WoW. The $0.14 increase in the 7-day moving average between the second and third week of May was the most significant two-week spike since the last week of 2022 following Christmas and the first week of 2023.
Meanwhile, initially reported contract rates excluding fuel continued to show downward movement, but the degree of declines has slowed considerably. As contract rate reporting is delayed by roughly two weeks, there is still some expectation of further declines as the data from the onset of new routing guides are fully collected. Despite contract rate decreases slowing, the surge in spot rates narrowed the gap between the two substantially in May. At just under $0.45, the contract-to-spot spread recorded its lowest level since January, when it dropped to just over $0.40 following the ice storms that blanketed the country. Prior to January’s reading, the spread between contract and spot rates have not been this low since April 2022, during the early stages of the current down cycle. Although May’s spread has moved to the high end of the pre-pandemic average range of $0.35-$0.45, there is still room for either contract rates to fall or spot rates to rise.
Why It Matters:
The out-performance of spot rates for the second consecutive month comes as a sign that underlying changes within the market are starting to take place. For starters, the volatility observed in the spot market in May was an indication that capacity was under more pressure comparable to the same time last year, especially during the week of International Roadcheck. Based on the DAT 7-day average linehaul spot rate index, DOT Blitz Week did little to disrupt capacity in 2023 as spot linehaul rates actually declined by $0.02 WoW. With rates jumping $0.07 WoW during the same week this year, the index moved slightly above YoY levels for the first time since April 2022. Although the annual gains were short-lived, falling back below the following week, it is a strong indicator that the bottom of the rate environment has been hit.
While the spot market gained some short-term momentum from the capacity disruptions, initially reported contract rates continue to trend lower as new contracts come online. The considerable slowing of declines in contract rates is likely an indication that side of the market has neared its floor as well. As the rest of the contract data is collected for the second half of May, there is still a possibility of further discounts, though they are not likely to be drastic. The narrowing of the contract-to-spot spread within a more normal range, and the impact that seasonal pricing trends had on rates in May, are positive signs for truckload pricing power. The only caveat is if those trends will continue through the busy summer shipping months or if the capacity glut will persist as the market continues to search for an inflection point.
Truckload Demand
Key Points
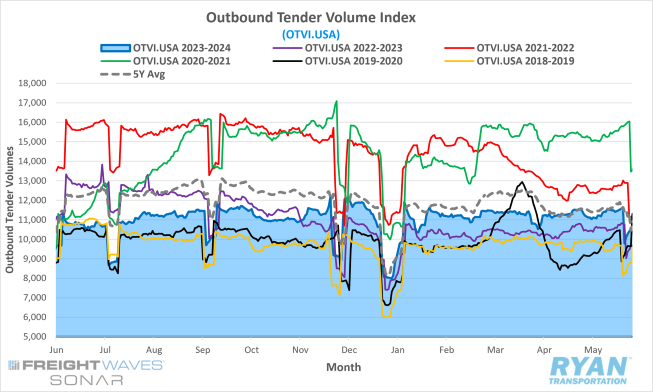
- The FreightWaves SONAR Outbound Tender Volume Index (OTVI.USA), a measure of contracted tender volumes across all modes, registered 1.3% higher MoM at the midway point in May compared to the same time in April, increasing from 11,272.96 to 11,414.42.
- The monthly average of daily tender volumes in May was 0.7% lower MoM compared to April, dropping from the 11,229.98 average in April to 11,153.69 recorded in May.
- Average daily tender volumes recorded by the FreightWaves SONAR OTVI in May were 6.8% higher compared to the same month last year and were 3.0% lower than the 5-year average.
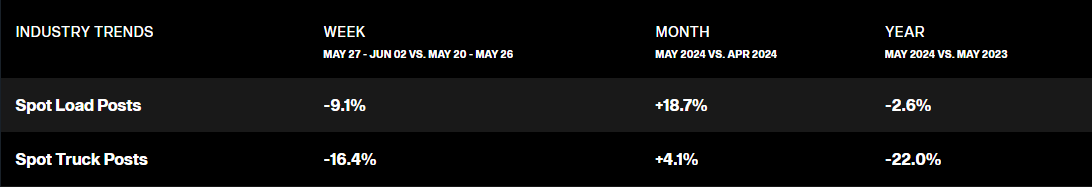
- Spot market volumes surged in May, increasing by 18.7% MoM compared to April, but was 2.8% below May 2023 levels.
- The Cass Freight Index Report, which analyzes the number of freight shipments in North America and the total dollar value spent on those shipments, was unchanged on a monthly basis for shipments while expenditures registered an increase of 1.9%. Both, however, remain below YoY levels by 5.8% and 9.0%, respectively.
Summary
After starting the month off slow, freight volumes in May continued its streak of stability that began at the start of the year. After gaining momentum in the final week of April, volumes recorded by the OTVI slumped in the first week of May, dropping 4.4% from where they started. The lull in activity was short-lived, however, as tender volumes all but erased the declines over the next two weeks with gains of just over 4%. In the week leading up to Memorial Day, tender volumes peaked for the month, jumping just over 1.1% during the week and 5.1% higher than levels recorded in the first week. Similar to most major holidays, volume levels dropped off considerably in the days immediately following Memorial Day, ending the month just under 7% below where they started.
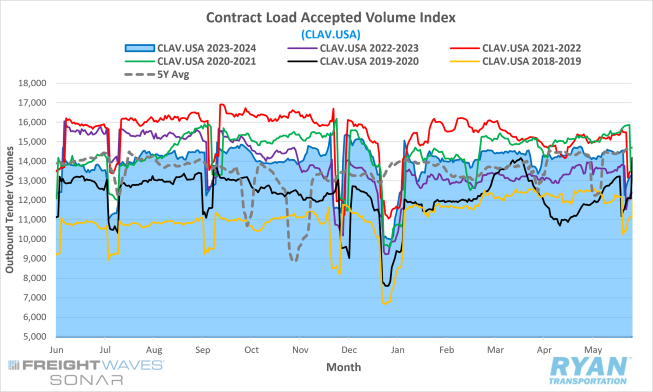
Based on mid-month levels to remove the post-holiday lull from skewing end-of-month comparisons, the OTVI was up just under 1.3% halfway through May from the levels recorded 30 days prior. This nearly matches the 26-day monthly average of tender volumes in May compared to the same timeline in April. On an annual basis, tender volumes remain elevated YoY and within reach of the 5-year average. The FreightWaves SONAR Contract Load Accepted Volumes Index (CLAV.USA), shown below, which is similar to the OTVI but removes tender rejections, confirms the continued strength in volumes as it remains elevated YoY, an indication that demand is working its way off the bottom.
While the majority of freight volumes continue to move under contract, the spot market saw market share return in May from the multiple capacity disruptions. The 18.7% MoM gain in spot volumes is the largest MoM increase since the cold snap in January delayed drivers from returning to the road. Annual levels still remained negative in May, but comparisons have become more favorable as the year progresses.
Why It Matters:
The rise in freight volumes in May was not unprecedented by any means. However, based on the resiliency of demand so far through the year, the gains are not insignificant either. The growth in overall volumes was widespread in May, with more than two-thirds of the 135 key market areas across the country registering higher MoM. Areas across the lower half of the states reflected more consistent gains with peak produce shipping officially getting underway.
According to FreightWaves, a number of the country’s largest freight markets registered increases in volumes MoM in May, which is generally considered a positive for the health of overall demand growth. Southern California in particular registered strong gains in May as volumes from Los Angeles were 22% higher compared to 2023, a sign that not just produce shipping but also containerized imports remained strong.
Some analysts have speculated that the recovery in freight volumes may not be what it seems. Jason Miller, a professor of supply chain management at Michigan State University, argued in a recent article in the Journal of Commerce that the key to recovery from the current freight recession, as was the case with past recessions, is strength in domestic manufacturing. Per Miller, 59% of ton-miles hauled by for-hire trucking firms originated at domestic manufacturing plants, while containerized imports accounted for roughly around 5% of ton-miles. Miller points out that output from freight-generating sectors such as food manufacturing, nonmetallic mineral products (i.e. concrete blocks), primary metals and paper remain several percentage points below the highs recorded in 2021 and 2022.
According to Miller, none of these sectors are poised for a robust seasonally adjusted rebound in the coming months and a recovery in domestic manufacturing is unlikely to materialize in 2024. Miller notes the primary headwinds holding back the recovery in domestic manufacturing, and ultimately the current freight recession, is the strong U.S. dollar and the decreased likelihood that interest rate cuts will drive domestic demand.
Truckload Supply
Key Points
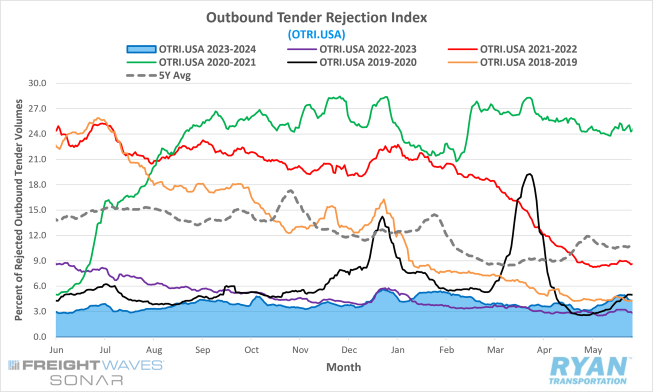
- The FreightWaves SONAR Outbound Tender Rejection Index (OTRI.USA), a measure of relative capacity based on carriers’ willingness to accept freight volumes under contract reflected as a percentage, registered 4.3% at the end of May, 1.1% higher than the 3.2% recorded 30 days prior.
- The monthly average of daily tender rejections registered 4.06% in May, 0.4% higher than April’s monthly average of 3.66%.
- Compared to May 2023, average tender rejections were 1.1% higher and 4.73% below the 5-year average.
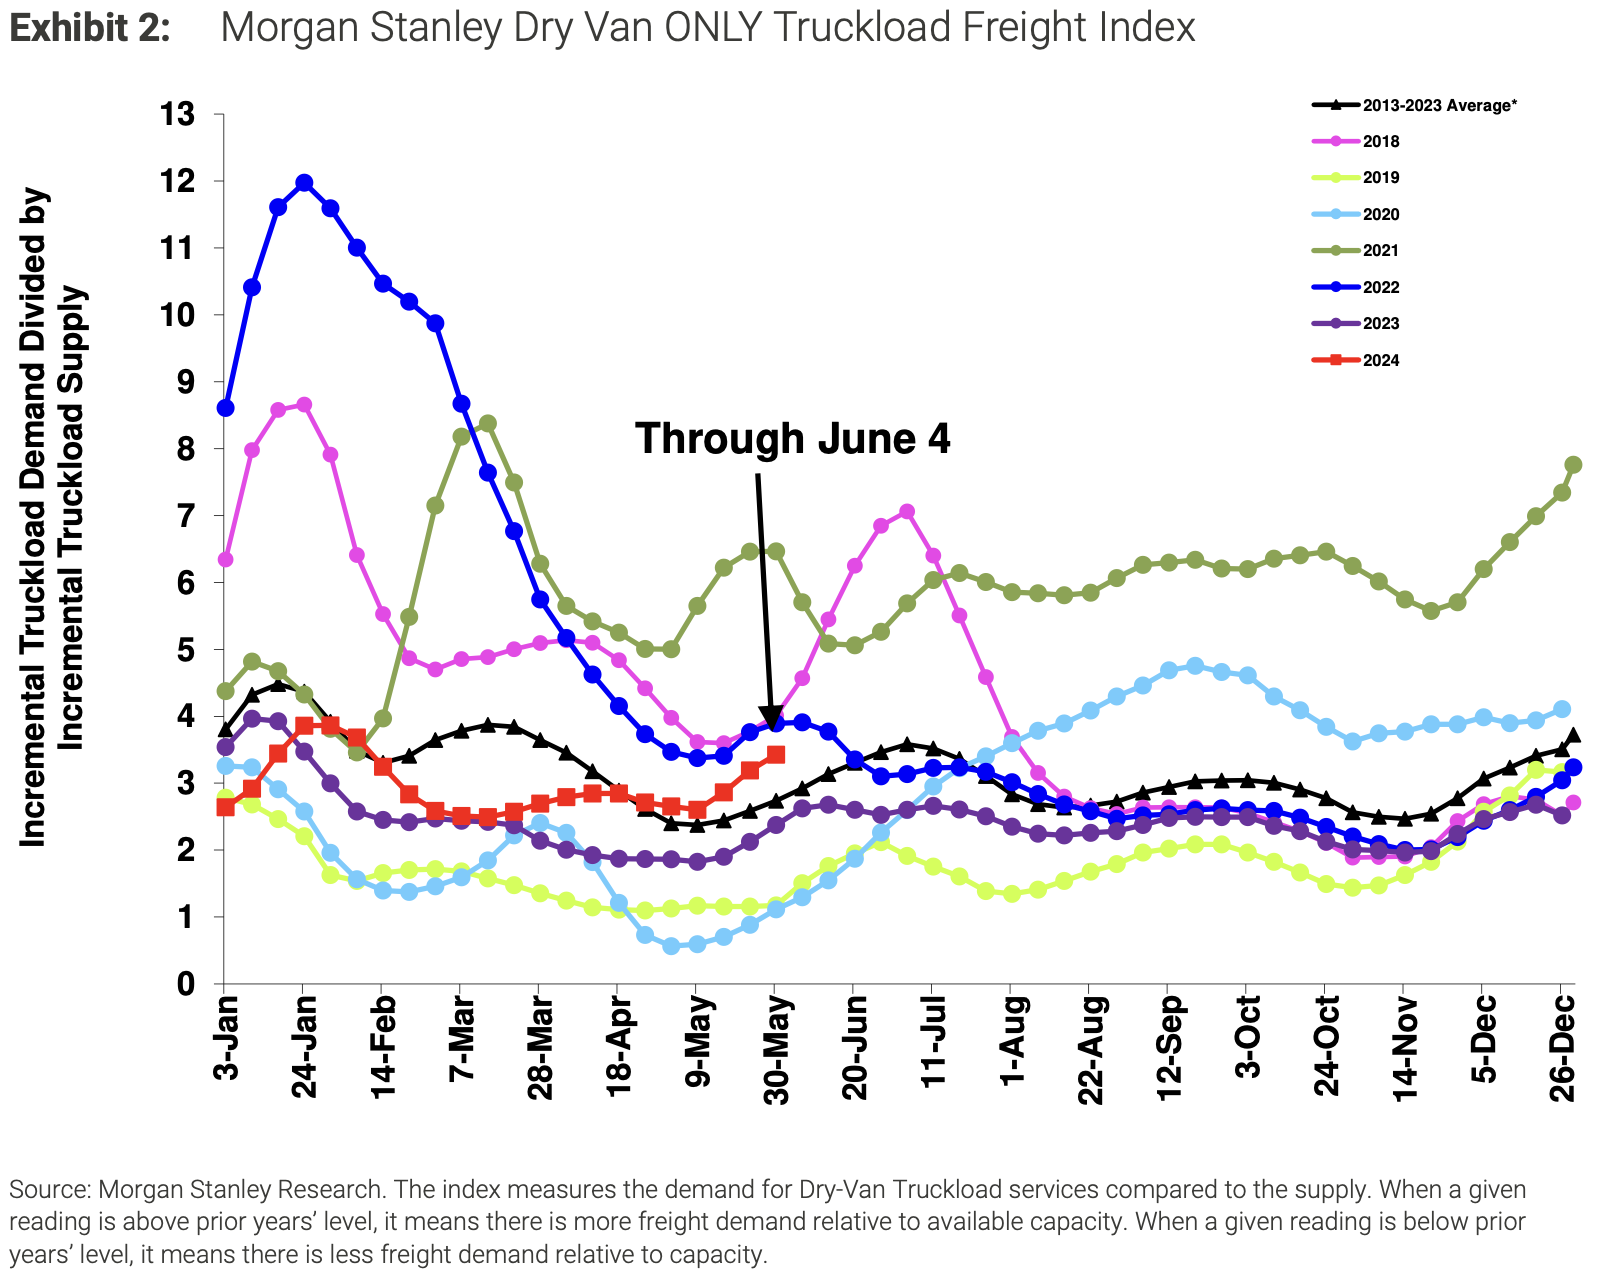
- The Morgan Stanley Truckload Freight Index (MSTLFI) registered sequential gains throughout May and continued to outperform seasonality, as the index has remained above the long-term average since early April.
Summary
Despite the multiple capacity disruptions observed in May, the overabundance of capacity continues to keep market conditions depressed. Tender rejections opened the month with a slight decline through the first few days of the week, before jumping 85 bps in the first half of the month to just below 4% ahead of International Roadcheck. After moving above the 4% mark during DOT Blitz Week, rejection rates jumped another 81 bps over the next two weeks to the month’s peak of 4.95% at the end of the week leading into Memorial Day weekend. Following the peak recorded by the OTRI, the index dropped 64 bps to end the month at 4.3%, a 1.1% increase from where it started the month.
Rejection rates have been steadily, but subtly, increasing since the second quarter of 2023. At 4.06%, the monthly average of daily tender rejections recorded by the index in May sits 44 bps higher than the average for all of 2023. While still below the 5-year average, May marked the lowest the differential has been between current and long-term averages at 4.73% since the inception of the index in March 2018.
According to the Morgan Stanley Truckload Freight Index report, the demand component increased sequentially throughout May and was in line with typical seasonality for this time of the year. Meanwhile, due to the International Roadcheck and Memorial Day, the supply component of the index saw sequential declines and underperformed seasonality. According to the report, both of the flatbed and reefer indices outperformed seasonality and registered increases in May.
Why It Matters:
Routing guide compliance as a whole remains at all-time highs, as tender rejections continue to reflect a market oversupplied with capacity. While there are regional pockets of tightness and rejections vary widely based on mode, as long as national levels hover below 5%, spot and contract rates remain in a deflationary state. Although the combination of International Roadcheck and Memorial Day provided a short-term boost to rejection levels, it was likely just confined to that and nothing with long-term implications.
At a more granular level, both reefer and flatbed rejection levels surged in May, as seasonal shipping commodity groups for both equipment types ramped up. According to the FreightWaves SONAR, flatbed tender rejections jumped 621 bps from 15.12% on May 19 to 21.33% on May 26, while reefer rejections were up from 6.75% to 8.61%, or 186 bps, during the same time period. As produce and construction activity continue through the summer, there is likely to be further tightening across the refrigerated and open-deck sectors at the expense of compliance levels. Unfortunately for the dry van sector, it is unlikely that the uptick in activity for the other two major modes will have any direct, positive impacts on van conditions.
Truckload Capacity Outlook
Key Points
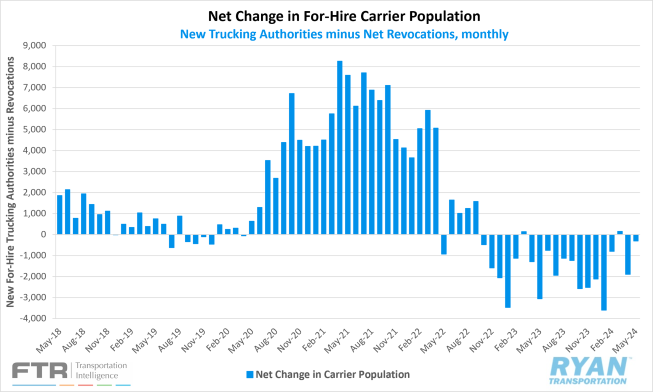
- Total net revocations, a measure of total authority rejections minus the number of reinstatements, dropped considerably in May by 1,321 carriers, decreasing from 6,830 revocations in April to 5,509 in May, according to FTR’s preliminary analysis of the Federal Motor Carrier Safety Administration’s (FMCSA) data.
- The number of newly authorized for-hire trucking companies increased by 266 carriers in May with the FMCSA authorizing 5,202 new operating authorities compared to 4,936 in April, per FTR’s reporting.
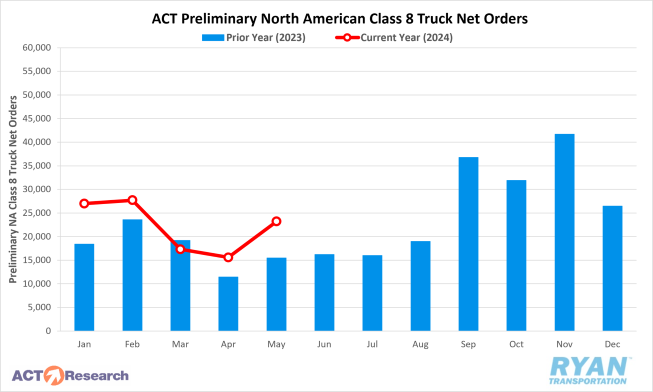
Depending on the estimate, preliminary North American Class 8 Orders in May ranged from 18,900 units as reported by FTR and 23,200 units per ACT Research’s analysis, with both estimates reflecting annual gains of 37.5% and 34.5%, respectively.
Summary
After a brief increase registered in March, following 11 consecutive months of declines, the net change in the carrier population dropped for the second consecutive month in May by 302 carriers. Despite a record setting net decline of just under 3,600 carriers in January, the decreases have become far more muted over the past few months. Since February, the carrier population has declined by 2,847 carriers, with April accounting for nearly two-thirds of that, according to FTR’s preliminary analysis of the FMCSA data. Net revocations appear to be settling as new entrants seem to be recovering from the lows recorded at the end of 2023. Per FTR’s reporting, the market has gained over 335,000 new operating authorities since July 2020, when the surge of new entrants began, but has only seen roughly 243,000 carriers lose their authority in the same time frame. This leaves the industry with roughly 92,000 more active operating authorities compared to the average before the pandemic.
As previously mentioned in May 2024 Industry Update, the rise and fall of operating authorities provides some insight into the for-hire capacity glut, but does not factor in the continued expansion across the private sector. According to the recent BLS jobs report, the trucking industry added roughly 9,400 actual unadjusted jobs in May, well short of the 14,800 expected. According to a report from the Journal of Commerce, May’s unadjusted labor numbers for the truckload industry are the lowest number for the month of May in the last 10 years of unadjusted employment data for trucking. Per the same report, trucking employment levels sit 1.5% higher than the fourth quarter of 2018, the base period for the index and a pre-pandemic employment peak in the for-hire trucking sector.
Meanwhile, equipment demand told a different story from the impending mass exodus that many in the industry are anticipating. Preliminary Class 8 orders exceeded expectations in May, outperforming both recent demand trends and seasonal averages for this time of the year. According to FTR, order levels in May were 2% above the average for the month of May in the last decade. Per both FTR and ACT Research’s reporting, private fleets and vocational markets continue to be the driving factors behind the further expansion in Class 8 orders.
Why It Matters:
With declines in the for-hire carrier population slowing and truckload payroll numbers expanding, even on a limited basis, the capacity situation continues to get more ambiguous. Despite stability in freight volumes through the first five months of the year, the market remains in a state of oversupply, as conditions have done little to improve. The recent trends in net revocations and new operating authorities indicate that the prolonged stagflation in the market has likely pushed out the weakest operators. Though it is not all doom and gloom, as data from May provided positive signs that the carrier exits thus far had allowed for seasonal factors to influence pricing, even on a short-term basis. However, should present levels persist, seasonal factors will be limited to just that, short-term boosts with longer-term impacts remaining muted.
As the for-hire sector continues to contract, the expansion of private fleets over the last year has only extended the timeline of sticky capacity in the current market. According to a recent report from ACT Research, private fleets have added more than the industry’s net capacity growth in the past year as the for-hire sector has contracted. As freight volumes have steadily risen, much of that growth has been handled by private fleets. With most private fleet operations being one-way, many are taking to the spot market in order to fill backhauls, which has only further delayed the for-hire rate recovery. Since backhauls are not a primary revenue generator for private fleets, many are willing to haul at a discount in order to move their equipment back within its typical routing guide.
Fuel Prices
Key Points
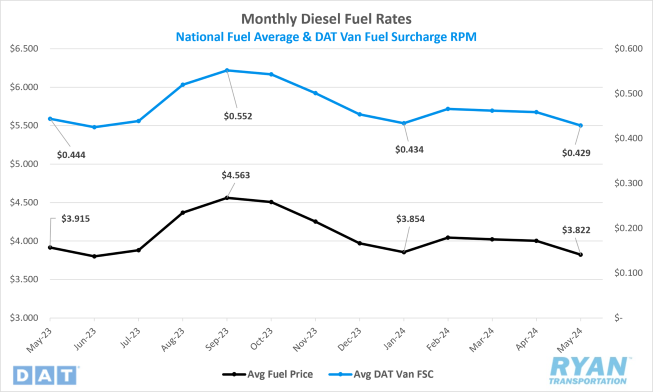
- The national average price of diesel dropped significantly in May, falling 4.5% MoM, or $0.180, from $4.002 in April to $3.822.
- Compared to the same month last year, average diesel prices were 2.4% lower, or $0.093.
- Draws on U.S. Crude outpaced builds in May but underperformed against expectations, -4.97M bbls versus the consensus of -10.08M bbls, for the weeks ending May 3 and May 31.
Summary
Average diesel prices fell steadily in May, continuing the negative trend that began the second half of April. To open the month, diesel prices fell roughly $0.05 WoW and continued to decline by an average of $0.045 WoW. The last week of the month saw a slowing in declines, with the average price of diesel registering a $0.03 decrease to close out the month. Compared to the same month last year, average prices were virtually flat, sitting 0.71% lower at the start of the month. However, as May progressed, diesel prices declined at a significantly quicker pace compared to 2023, ending the month roughly $0.10 lower than the same time last year.
The benchmark retail price of diesel has declined for six consecutive weeks, with the price drop in the first week of May being the most significant one-week decrease since December. The current price of $3.758 per gallon is the lowest since January, reflecting a broader downward trend in oil and diesel prices that started in early April. Factors such as the lack of impact from Middle East violence on oil supplies and the decrease in international crude prices have contributed to this trend. Ultra-low sulfur diesel (ULSD) prices on the CME exchange have also followed this downward trajectory, despite tight diesel inventories that are just beginning to show signs of improvement in the U.S.
Market dynamics have shifted from backwardation to contango in the ULSD futures market, which is encouraging inventory building. The contango indicates a higher future price compared to the current spot price, incentivizing storage rather than immediate sale. Reports suggest that renewable diesel is increasingly influencing the market, as regulatory changes prompt refiners to produce more renewable diesel, reducing traditional diesel demand. Analysts note that weak diesel demand, exacerbated by a slow trucking market and rising renewable diesel use, is contributing to overall oil market softness. The entry of new diesel exports from Nigeria's Dangote refinery could further pressure diesel prices, highlighting ongoing bearish trends in the diesel market.
Why It Matters:
The steady decline in diesel prices over the past nine weeks is a welcomed relief, as rates remain historically low and overall operating costs continue to increase. The lack of impact from the conflict in the Middle East and OPEC+ continued production cuts indicates that global supply levels remain abundant compared to demand. Despite the futures market for ULSD shifting to contango, the spread is not deep enough to overcome costs of storage, so the data has yet to be reflected in the data released by the Energy Information Association (EIA).
Although signs continue to point towards a bearish oil market in the near-term, OPEC+ has recently started singing a different tune. At the most recent meeting, OPEC+ updated forecasts to reflect a strengthening in oil demand in the second half of 2024. In its monthly report, OPEC+ data showed an increase in world oil consumption YoY of 2.3M bbls per day in the back half of the year, roughly 150,000 more than the first half. In order to maintain supply levels with the increased demand, the 22-member-nation alliance plans to gradually restore 2M bbls per day of current production cuts, led by Saudi Arabia. While this outlook would be considered a positive for those in the oil industry, OPEC’s forecasts have proved to be excessively bullish in the past.
Dry Van Overview
Spot Rates
Key Points
- The national average dry van spot rate excluding fuel increased 3.3% MoM, or $0.05, in May to $1.581.
- Compared to May 2023, average dry van spot linehaul rates this May were 1.6% lower and were 10.3% below the 5-year average.
- Initially reported average dry van contract rates exclusive of fuel registered a slight increase, rising 0.5% MoM to just over $2.00, but remains 6.3% below May 2023 levels.
Load-to-Truck Ratio
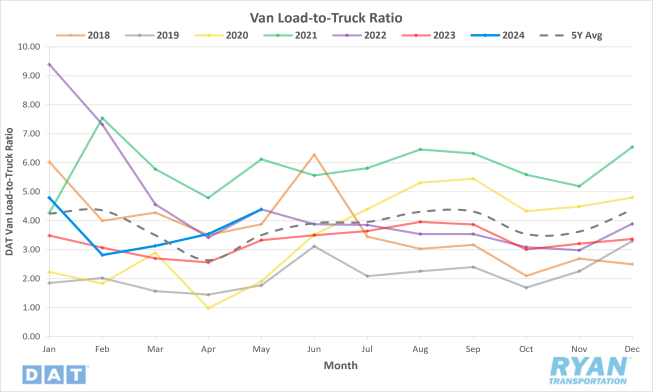
Key Points
- The dry van load-to-truck ratio (LTR) registered 4.39 in May, a 24% increase over April levels and 31.8% higher compared to May 2023.
Market Conditions
Dry Van Summary
The dry van sector received a lifeline in May, as the uptick in summer freight volumes ahead of Memorial Day paired with capacity disruptions caused rates to increase for the first time in four months. Prior to May’s slight increase, dry van spot rates excluding fuel had fallen 10.3%, or just under $0.18, between January and April. The impact of the soft rate environment so far in 2024 was most evident in the weak earnings of large, publicly traded dry van TL carriers in Q1.
Although the number of loads per truck in the dry van industry has been steadily rising since its near record low in February, most of that growth has been handled by private fleets. This has become increasingly problematic for the excess capacity that remains in the for-hire sector, which continues to contract at an exceptionally slow pace. Whatever volumes do end up moving in the for-hire sector are easily absorbed and further depresses conditions within the industry.
Unfortunately for dry van carriers, especially for-hire trucking firms, the outlook for improving conditions remains bleak through the rest of the year. With the exception of holiday and seasonal influences, the industries responsible for driving growth for dry van carriers are not posed for any significant rebounds over the next six months. While it is likely that dry van spot rates have found a bottom, the signs for any significant increases in the near-term are not encouraging.
Reefer Overview
Spot Rates
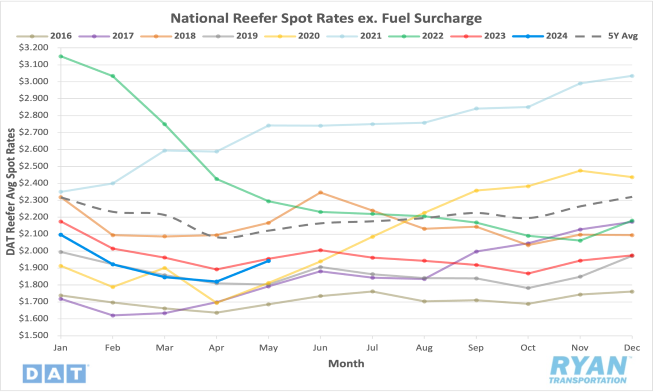
Key Points
- The national average reefer spot rate excluding fuel surged in May, increasing 6.7% MoM, or $0.12, to just over $1.94.
- Average reefer spot linehaul rates were down 0.7% compared to the same month last year and sit 8.4% below the 5-year average.
- The national average contract rate excluding fuel was virtually flat in May, increasing0.1% MoM, and was 3.8% lower compared to May 2023.
Load-to-Truck Ratio
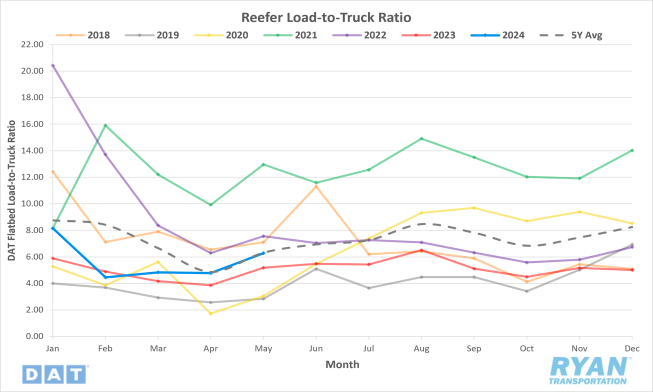
Key Points
- The reefer LTR registered 6.28 in May, a 31.4% MoM increase and 21.2% higher than May 2023 levels.
Market Conditions
Reefer Summary
Refrigerated carriers were the largest beneficiaries in May compared to the other major modes, thanks to the insurgence of produce volumes from the peak spring harvest season and summer beverage shipping ramping up. The refrigerated sector saw immediate gains at the start of the month as retail spending on Mother’s Day surged. According to the National Retail Federation (NRF), preliminary estimates of retail spending for Mother’s Day in 2024 are projected to total roughly $33.5 billion, making it the second highest grossing Mother’s Day on record, just behind last year. Per the NRF report, flowers account for roughly 73% of Mother’s Day spending, with 90% of flower imports coming in through Miami and the southern ports of Florida. With a shelf life of 10-14 days, the sensitivity of demand causes rates to surge, driving up rates for other commodities shipping from the area as well.
On the other side of the country, strawberries and cherries out of California reflected strong output with strawberry volumes in May nearing the record highs set back in 2018. Peak strawberry shipping is set to continue through June, transitioning from the southern and mid-California regions to further north, where volumes are projected to remain strong if not stronger. Blueberry yields were exceptionally high last month as well, so much so that it resulted in an oversupply of the crop that ultimately cut its peak shipping season short, but not without tightening capacity and driving refrigerated rates up further first.
Produce volumes should continue to make headwinds in the refrigerated sector over the next few months as volumes shift north based on the different peak harvest seasons per region. For a full breakdown of timing and produce by state, check out our Seasonal Produce By State article on the Ryan Transportation website.
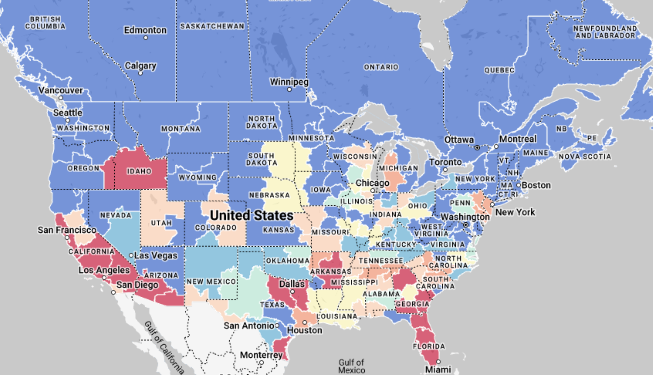
Flatbed Overview
Spot Rates
Key Points
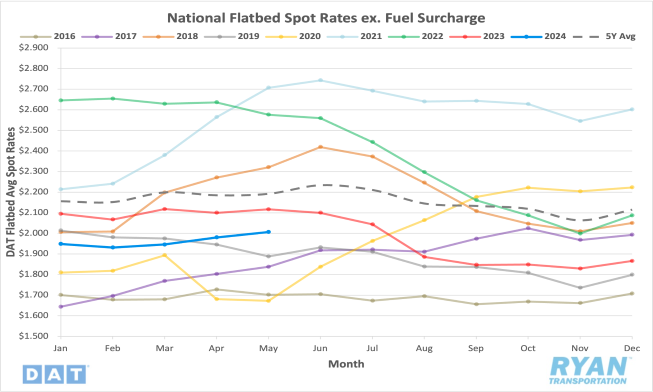
- The national average flatbed rate excluding fuel rose 1.3% MoM, or $0.03, to just under $2.01 in May.
- Average flatbed linehaul spot rates were down 5.2% on an annual basis and were 8.5% lower than the 5-year average.
- The national average flatbed contract rate excluding fuel fell 0.5% MoM and was down 5.5% compared to the same month last year.
Load-to-Truck Ratio
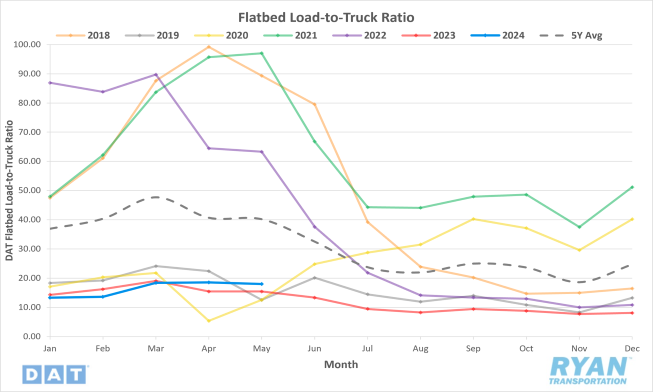
Key Points
- The flatbed LTR registered 17.97 in May, a 2.9% decline MoM but 16.6% higher than levels recorded in May 2023.
Market Conditions
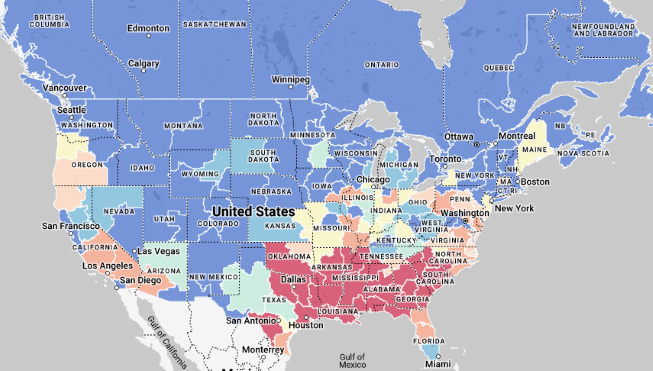
Flatbed Summary
The American Iron and Steel Institute (AISI) reported a 3% YoY decrease in domestic raw steel production, with 1,716,000 net tons produced and a capability utilization rate of 77.3% for the week ending April 20. YTD production is also down 2.5%, reflecting a trend of declining steel production. This reduction in steel output signals potential changes in demand and supply dynamics that could affect logistics and freight needs, especially for those involved in transporting raw materials and finished steel products.
Flatbed volumes in the New Orleans freight market have surged by 36% compared to last year, driven by increased breakbulk imports, particularly steel, into Port NOLA. This port, significant for breakbulk tonnage, underscores the importance of New Orleans for flatbed carriers. Linehaul rates have seen notable increases, with rates to Houston, for example, up 14% YoY to $2.44 per mile. The anticipated construction of the Louisiana International Terminal (LIT) will further enhance breakbulk volume, presenting long-term growth opportunities for the freight market.
The residential housing market shows mixed signals for flatbed demand. While single-family home construction was flat in April, it remains 22% higher than last year. However, higher mortgage rates and declining consumer confidence are creating headwinds. Indicators like the Fannie Mae Home Purchase Sentiment Index and the National Association of Home Builders Housing Market Index reflect a cautious outlook, suggesting that while the demand for flatbed services in the housing sector remains strong, it may plateau in the short term.
Regional freight dynamics reveal varying trends. In Texas, despite a 5% increase in loads moved, linehaul rates have slightly decreased. The Southeast region, however, shows tightening capacity and rising rates, with significant increases in outbound rates from cities like Atlanta and Savannah. The Gulf Coast also reports higher steel import volumes, contributing to increased load movements and fluctuating rates. Overall, these regional trends highlight the importance of monitoring market-specific indicators to navigate the complex landscape of freight logistics effectively.
Intermodal
Spot Rates
Key Points
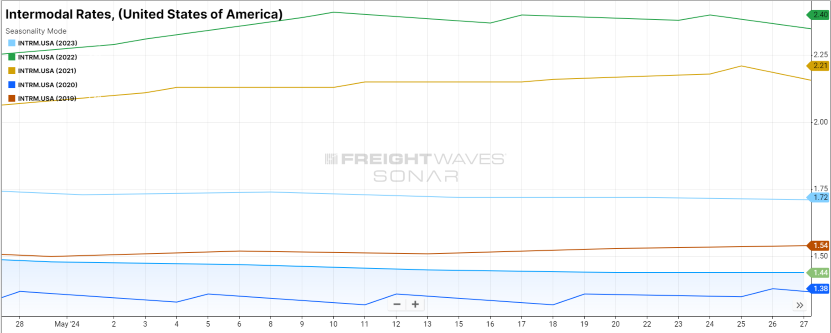
- The FreightWaves SONAR Intermodal Rates Index (INTRM.USA), which measures the average weekly all-in door-to-door intermodal spot rates for 53’ dry vans across a majority of origin-destination pairings, fell slightly in May, dropping 2.7% MoM, or $0.04 to $1.44.
- Compared to May 2023, intermodal spot rates are down 15.8% YoY and dropped to 20.5% below the 5-year average.
Volumes
Key Points
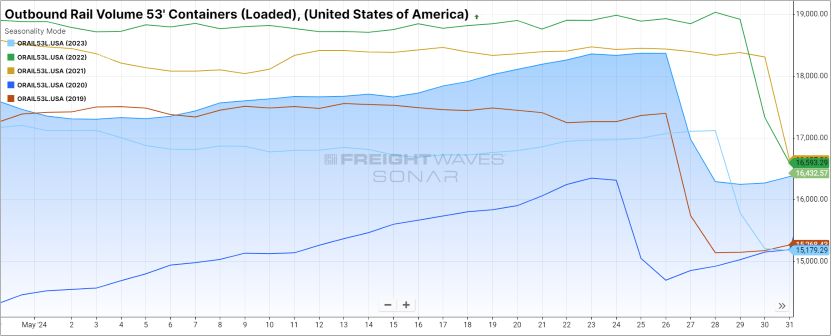
- Total loaded volumes for 53’ containers from all domestic markets, measured by the FreightWaves SONAR Loaded Outbound Rail Volume Index (ORAIL53L.USA), were up 2.7% MoM at the midway point of May compared to April.
- Compared to the same time last year, total loaded volumes for 53’ containers were 5.6% higher and were 1.5% above the 5-year average.
Intermodal Summary
The intermodal market continues to gain momentum, as overall volumes remain positive compared to last year’s levels. Intermodal traffic has been trending positive for the past several months, with the American Association of Railroads (AAR) reporting an annual gain of 8.7%, or 443,453 units, in May. Increased port activity and intensified efforts by Class I carriers to compete with the softening truckload market have led to volumes continuing their upward trajectory since the second half of 2023. Overall carload traffic continues to struggle on an annual basis, however, as coal volumes remain depressed compared to last year, posting a 22% YoY decline in May. While the negative trend in coal is unlikely to reverse course in the near-term, other commodities such as intermodal volumes and petroleum have provided a significant amount of growth potential for rail carriers and are likely to be a strategic focus in the future.
Despite the strong growth in volumes, overall rates continue to decline as a means to remain lucrative against weakening over the road rates. The FreightWaves SONAR Intermodal Contract Savings Index (IMCSI1.USA), which is the percent difference between the initially reported dry van contract rate excluding fuel and the initially reported intermodal contract rate excluding fuel, dropped to 6.91% in May from 8.33% in April. The further discounting of rates amidst growing volumes should put the intermodal market in a solid position to gain even more volume once the truckload market shows signs of tightening up again. While competition for market share is the primary force behind the negative trend in rates, the sharp decline in all-spot rates indicates there remains an abundance of available container capacity. During periods when container capacity is tight, such as mid-2020 to mid-2022, intermodal spot rates spike well above contract rates as carriers protect capacity for contractual shippers. This has led to rate forecasts through the end of the year to remain virtually flat, with possibly a 0.1% increase for intermodal volumes and no growth for carload traffic pricing.