Back to October 2024 Industry Update
October 2024 Industry Update: Dry Van
Dry van volumes remained weak in September, pushing average spot rates down further for a third consecutive month.
Spot Rates
Key Points
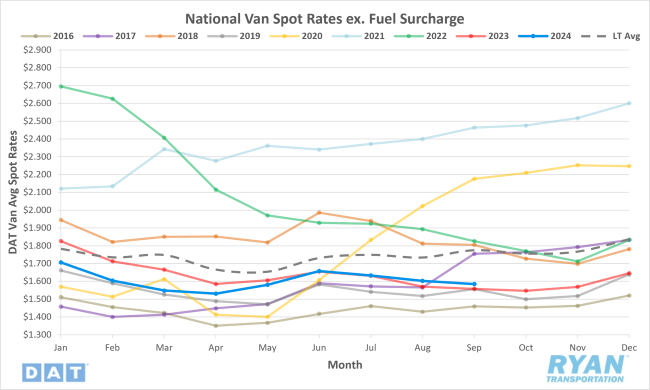
- The national average dry van spot rate excluding fuel declined 1.1%, or $0.02, in September to just under $1.59.
- Compared to September 2023, the average spot linehaul dry van rate was 1.7% higher YoY and 10.7% below the LT average.
- The initially reported national average dry van contract rate exclusive of fuel increased 1.2% MoM in September but was down 1.1% compared to the same month last year.
Load-to-Truck Ratio
Key Points
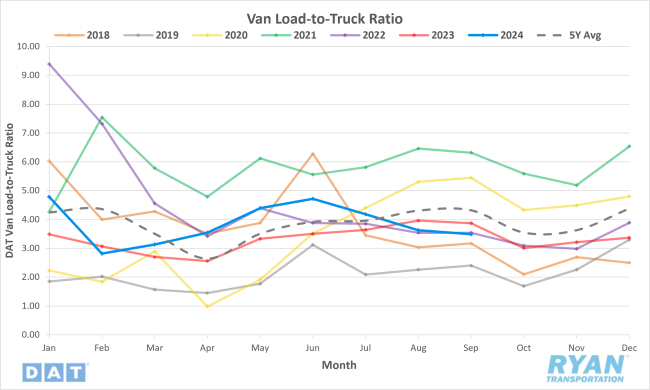
- The dry van load-to-truck ratio (LTR) declined 3.9% MoM and was down 9.8% compared to September 2023.
- Compared to the 5-year average, the dry van LTR registered 19.1% below in September.
Market Conditions

Dry Van Summary
Despite a 21% reduction in fuel prices, the profitability for carriers in 2024 has fallen below 2019 levels, making this one of the worst periods since the bull market of 2018. For small carriers or owner-operators driving 100,000 loaded miles annually, breakeven costs were just over $1.79/mile in August, while spot rates averaged $2.01/mile. This created an approximate gross loss of $3,000/year per truck, a significant decline from the $64,000/year gross profit seen in 2021. Carriers with no financing costs have a competitive advantage, operating at $1.43/mile, while those with truck and trailer financing face added costs of $0.36/mile.
Demand for truckload services is also weak. The Institute of Supply Managers' New Orders index dropped by 6% in August, indicating continued contraction in the manufacturing sector. As factory activity remains subdued due to low demand and increased inventories, carriers face additional pressure for profitability. Suppliers report improved capacity and reduced shortages, but companies are hesitant to invest amid economic uncertainty and cautious monetary policies, contributing to weak production output and restrained growth.
The logistics sector saw a slight growth in the Logistics Manager's Index (LMI), driven by rising inventory levels in anticipation of Q4 demand. Inventory expansion is paired with increased transportation and warehousing capacity, partially due to smaller carriers re-entering the market. However, the Cass Freight Index showed a modest 1.0% MoM increase in shipments, while truckload linehaul rates continued their downward trend. Competitive bidding persists due to market oversupply, and while spot rates remain steady, they haven't substantially boosted contract rates.
These trends indicate that while the dry van market is experiencing short-term volatility, indicators suggest a challenging environment looms for brokers, carriers and shippers in the long term, with weaker demand and rates compared to historical norms.