Back to October 2024 Industry Update
October 2024 Industry Update: Truckload Rates
Average truckload spot rates declined further in September while contract rates registered a slight increase, further widening the contract-to-spot spread.
Spot Rates
Key Points
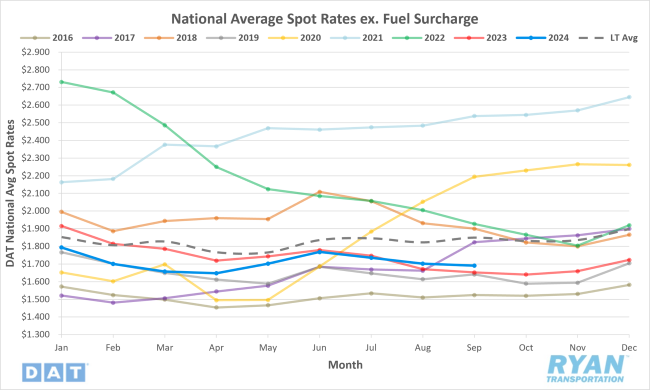
- The national average spot rate excluding fuel declined 0.6% MoM, or $0.01, in September to $1.69.
- Compared to September 2023, average spot linehaul rates were 2.4% higher YoY and 8.6% below the long-term (LT) average.
Contract Rates
Key Points
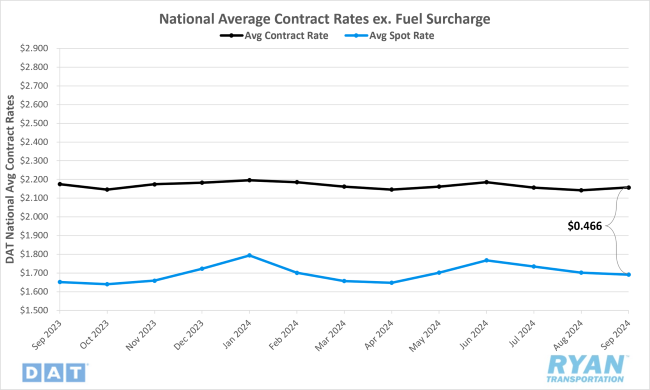
- Initially reported average contract rates excluding a fuel surcharge rose slightly by 0.7% MoM, or just under $0.02, in September.
- On an annual basis, average contract linehaul rates were 0.8% lower YoY compared to September 2023.
- The contract-to-spot spread increased by $0.026 MoM, rising from $0.44 in August to $0.466 in September.
Summary
National average spot rates continued to decline in September, marking the third consecutive monthly decrease, though the rate of decline slowed compared to the previous two months. While the MoM decrease was less pronounced, the 0.6% drop fell short of typical seasonality, where rates generally rise by 1.5% MoM in September. Despite the continued decline, average linehaul spot rates remained above YoY levels for the second straight month.
According to weekly data from the DAT 7-day Linehaul Spot Rate Index, rates experienced a steady decrease throughout September, with the most significant WoW drop occurring in the week following Labor Day. Linehaul rates fell by over 3% during the first two weeks of the month but saw a temporary rebound, increasing by 1.6% in the third week. However, this upward momentum was short-lived, as rates declined by 2.2% throughout the remainder of the month, closing September approximately 1.7% below where they began.
In the contract market, initially reported linehaul rates saw a slight increase in September, following two months of consecutive declines. The $0.02 MoM increase in September represents the second-largest monthly rise in 2024, just shy of the increase recorded in June. On an annual basis, contract rates showed further improvement, with the differential in September reaching its narrowest level since August 2022 (-0.8%). As contract rates rose and spot rates continued to decline, the contract-to-spot spread widened to just under $0.47, exceeding the pre-pandemic average range of $0.35 to $0.45.
Why It Matters:
As we approach the peak pre-holiday shipping season, the stagnation of spot rates throughout September indicates that several negative factors continue to impede a recovery in truckload pricing. The primary challenge remains excess capacity relative to demand. However, in recent months, the reemergence of seasonality hinted that supply contractions were gradually bringing the market closer to equilibrium. Despite these trends, September data reflected no significant seasonal impacts. This was first evident in the muted reaction to Labor Day followed by a lack of movement throughout the month, culminating in average rates remaining flat during the final week of the quarter.
One possible explanation for the lack of seasonal pressure typically associated with peak shipping season is the threat of port strikes along the East and Gulf Coasts, led by the International Longshoremen’s Association (ILA). The early awareness of potential disruptions likely caused a pull-forward of import shipments, contributing to elevated downstream inventory levels, as indicated in the September Logistics Managers' Index report.
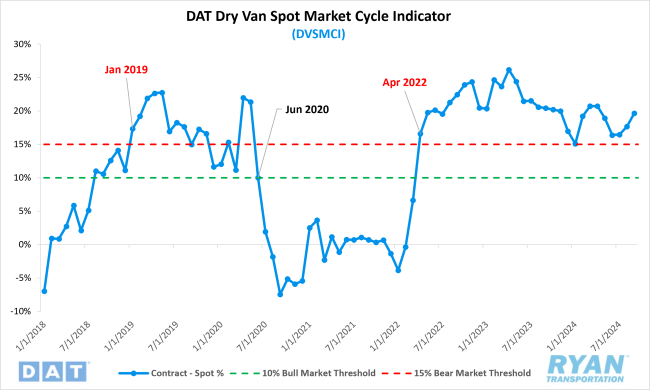
On a positive note, spot rates in September remained higher than the previous year, signaling the market's recovery from its lowest point. However, the gap between current rates and the long-term average continued to widen for the fourth consecutive month in September. This followed a narrowing trend in May when the margin decreased to 3.6%, the second-lowest level in 2024. Additionally, the DAT Dry Van Spot Market Cycle Indicator (DVSMCI), which compares spot and contract rates, rose from 17.7% in August to 19.7% in September. According to Jason Miller, Interim Chair of the Department of Supply Chain Management at Michigan State University, who developed the index, a ratio above 15% signals a bear market, while a ratio below 10% suggests a bull market.