Back to September 2024 Industry Update
September 2024 Industry Update: Dry Van
Dry van conditions declined in August as both rates and volumes trended lower compared to the previous month.
Spot Rates
Key Points
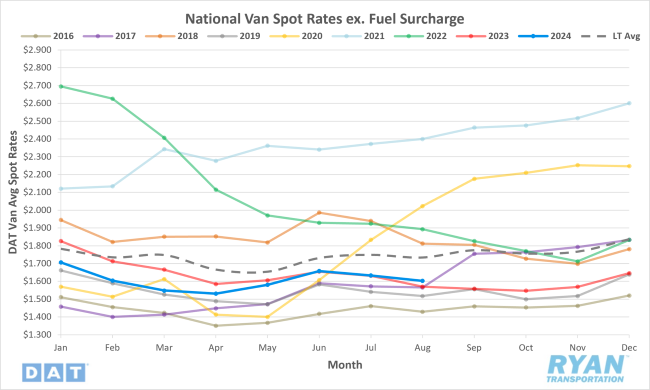
- The national average dry van spot rate excluding fuel declined 1.9% MoM, or $0.03, in August to $1.60.
- Compared to August 2023, the average spot linehaul dry van rate was 2% higher YoY and sits 7.6% below the LT average.
- The national average dry van contract rate exclusive of fuel was unchanged MoM in August and registered 2.3% below the same month last year.
Load-to-Truck Ratio
Key Points
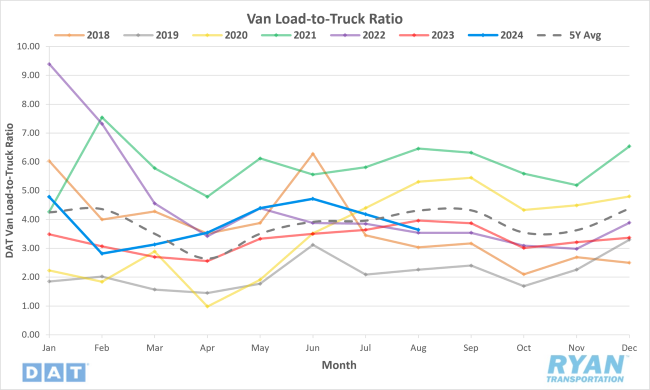
- The dry van load-to-truck ratio (LTR) declined 12.9% MoM and was down 8.1% compared to August 2023.
Market Conditions
Dry Van Summary
IHS Markit data for U.S. container imports in July 2024 were the third highest on record, following peak volumes during the pandemic surge. U.S. container imports in July rose 11.2% MoM, reaching 2,556,180 twenty-foot equivalent units (TEUs), and is the first time in 26 months that volume has surpassed the 2.4 million TEU threshold. This growth in import volume over the first seven months of 2024 is 15.6% higher than in 2019, and the volume was 17% higher than the July monthly average going back to 2015. This could result in an estimated 150,000 more dry van truckloads for carriers. The Port of Los Angeles Signal Report predicted the arrival of 24 vessels in the week of August 15 delivering over 130,00 containers, a 24% increase from last year.
The Logistics Manager’s Index (LMI) recorded a 56.5 in July, up 1.2 from June’s reading of 55.3, marking eight consecutive months of expansion. The report noted that subdued growth can be attributed to the third consecutive month of contraction in inventory levels at 49.5. However, in June, inventory levels increased upstream but contracted downstream. The report suggests that retailers kept inventories lean to start Q3, while manufacturers, wholesalers and distributors built up goods for distribution later in the year.
A strong focus is being placed on Los Angeles and other West Coast ports, partly due to the increase in imports as shippers are concerned about the labor contract negotiations with the International Longshoreman’s Association (ILA). The union covers 45,000 dockworkers on the East and Gulf coasts and the contract expired at the end of August. According to the Journal of Commerce (JOC), imports to the East and Gulf coasts must depart Asian ports by mid-August to ensure goods reach shelves in time for Black Friday sales. The voyage time is around 30 days, so retailers and importers rush to book their shipments by this timeframe to avoid issues from a potential strike by the ILA.
For brokers and carriers, this surge in container volume leads to a freight overflow into the truckload market as shippers rush to transload containers to dry van for distribution. Keep an eye on Los Angeles and Ontario, as they heated up in August. According to Paul Brashier of ITS Logistics, they have moved the West Coast Ocean region to SEVERE concern and inland rail ramps to ELEVATED concern. Reroutes to avoid strikes in Canada and labor disruption on the East Coast have caused an increase in volume to the West Coast, and shippers can transload and ship by one-way truck while capacity remains.