Back to September 2024 Industry Update
September 2024 Industry Update: Truckload Rates
Spot rates erased their summer gains in August while contract rates remained stable, pushing the contract-to-spot spread to the higher end of the pre-pandemic average range.
Spots Rates
Key Points
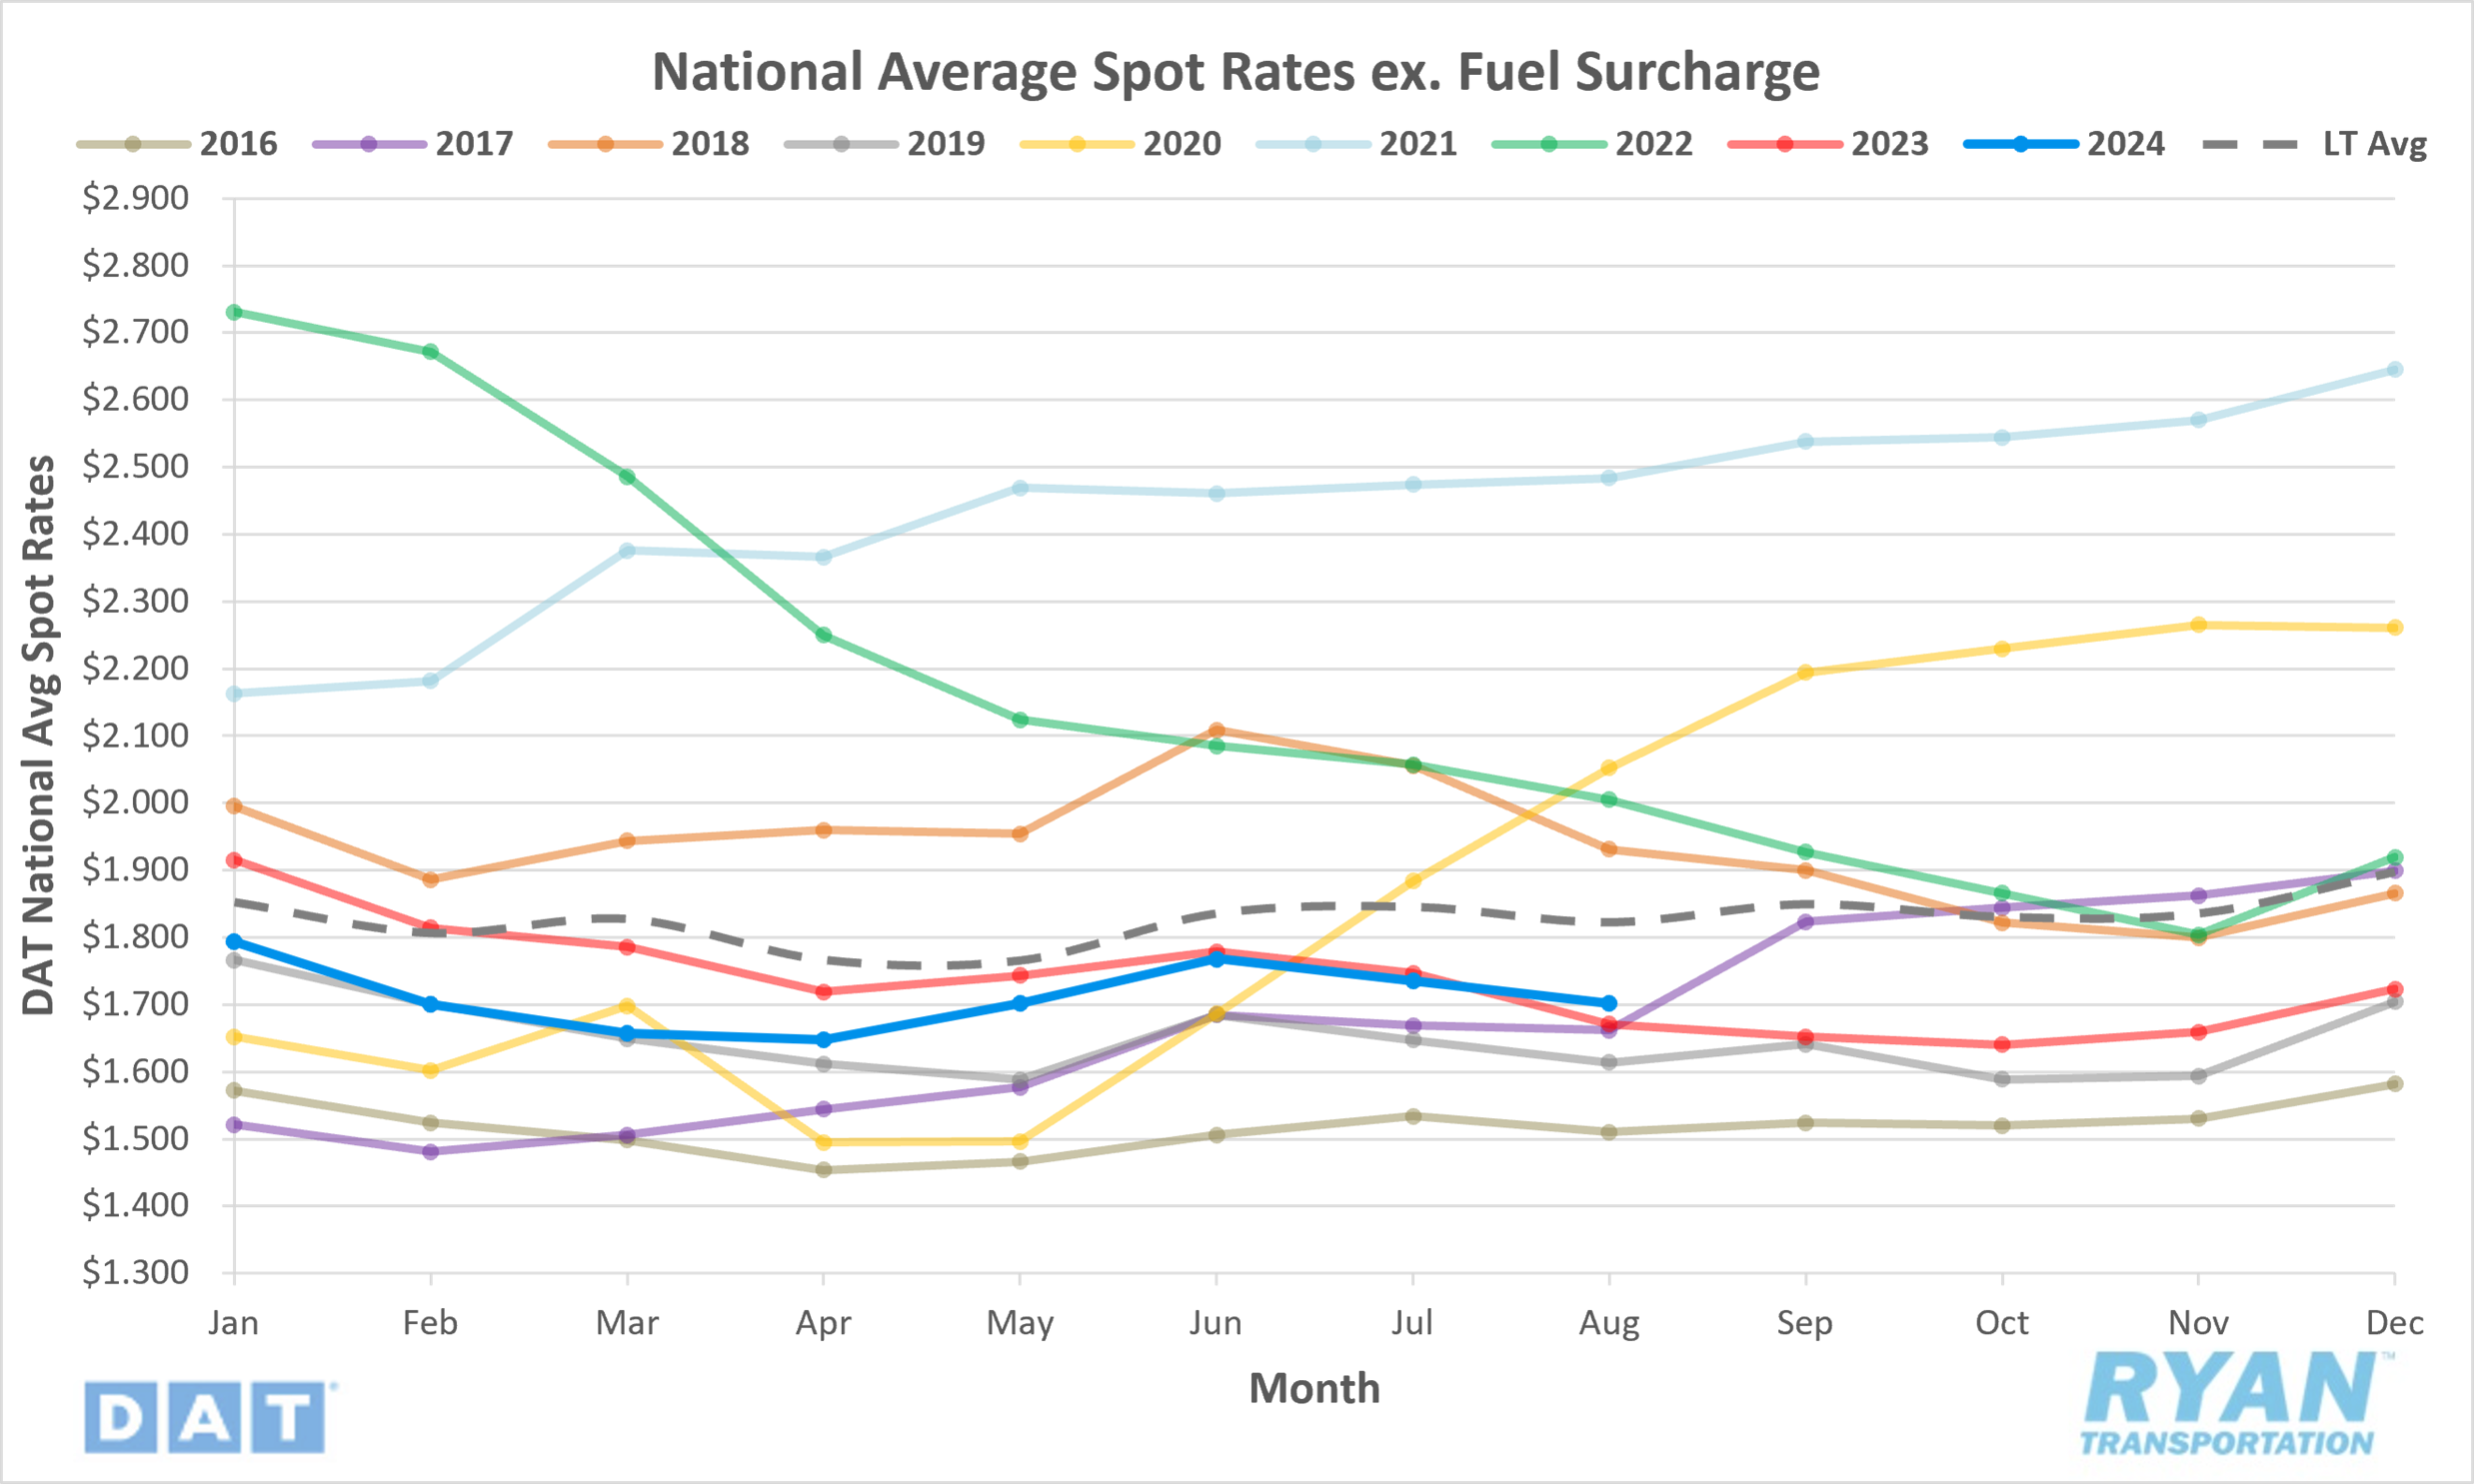
- The national average spot rate excluding fuel declined by 1.9% MoM, or $0.03, in August to $1.70.
- Compared to August 2023, average spot linehaul rates were 1.9% higher YoY and sit 6.6% below the long-term (LT) average.
Contract Rates
Key Points
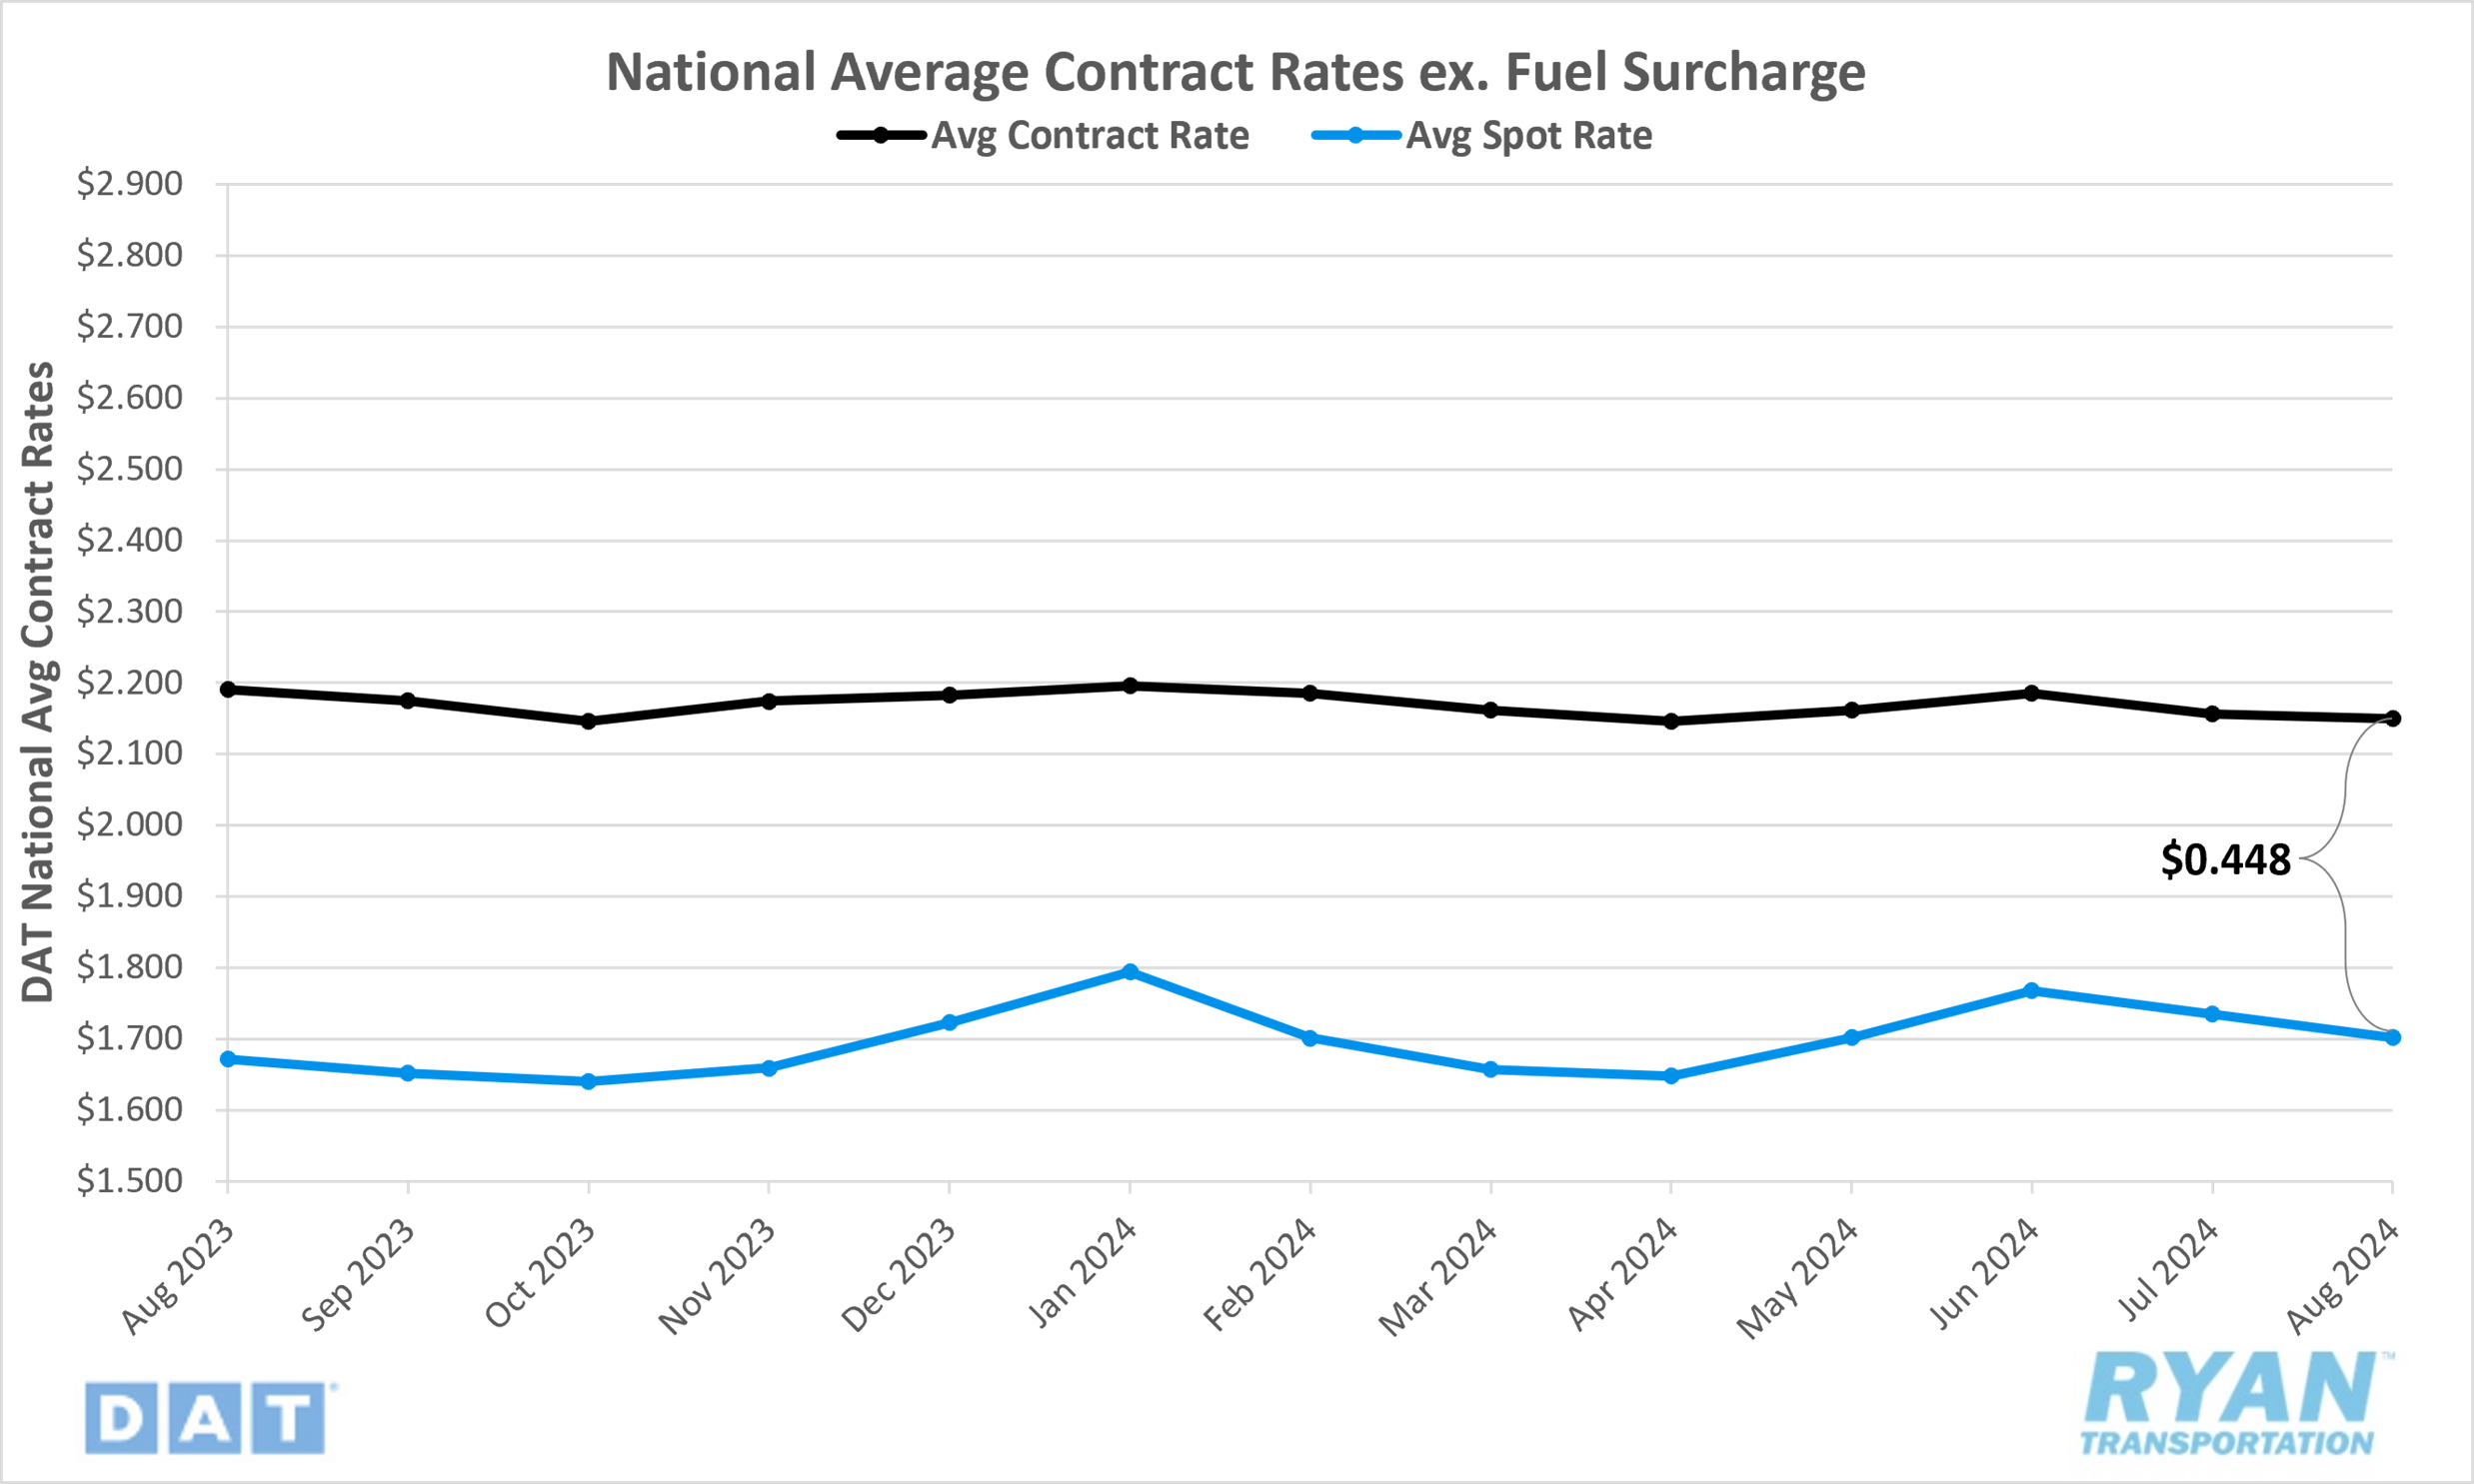
Initially reported average contract rates excluding a fuel surcharge fell slightly by 0.3% MoM, or $0.006, in August.
On an annual basis, average contract linehaul rates were 1.9% lower YoY compared to August 2023.
The contract-to-spot spread increased by $0.027 MoM, rising from $0.421 in July to $0.448 in August.
Summary
Average spot rates have returned to levels observed in May following two consecutive months of declines in July and August, which offset the gains recorded in June. While a MoM decrease is typically anticipated in August, the 1.9% decline observed last month slightly exceeded the average seasonal decline of 1.2% but performed better than the pre-pandemic average decline of 2.6%. Despite the consecutive monthly decreases, average rates in August surpassed the previous year's levels for the first time since March 2022. However, after narrowing the gap to the LT average in May and June, the reductions in July and August widened the gap once again to 6.6% below.
Weekly data from the DAT 7-day linehaul spot rate index shows that rates moderated throughout August. After beginning the month $0.02 lower WoW, rates rebounded over the following two weeks, increasing by $0.03 to reach their highest level since the week after the Fourth of July. However, this upward trend stalled in the week leading up to Labor Day, with rates falling by $0.02 to close out the month.
In the contract market, following the decline in July, which was the largest MoM decline since August 2023, average linehaul rates remained relatively stable in August with a decrease of less than $0.01. Average contract rates have continued to demonstrate stability in 2024, fluctuating within a narrow margin of less than $0.01. Contract rate comparisons have shown improvement on an annual basis, with the differential in August reaching its lowest level since September 2022 (-1.7%). As contract rates remained relatively steady in August, while spot rates were further discounted, the contract-to-spot spread widened by approximately $0.03 to $0.45, moving into the higher end of the pre-pandemic average range.
Why It Matters
A further decline in spot rates was to be expected in August, as the month acts as a transitionary period between summer shipping activity and peak pre-holiday shipping. The gains observed around the onset of International Roadcheck in mid-May have disappeared as rates have returned to their pre-summer levels. Although the further decline in average spot rates isn’t ideal for carriers already operating on razor-thin margins, there are still some positive signals reflected in the data. For starters, the outperformance of seasonality compared to the pre-pandemic average is a good indication that capacity exits are helping to return the market closer to balance. Another optimistic signal stemmed from annual comparisons turning positive after 28 months of registering below YoY levels, which confirms the market has moved up from the bottom.
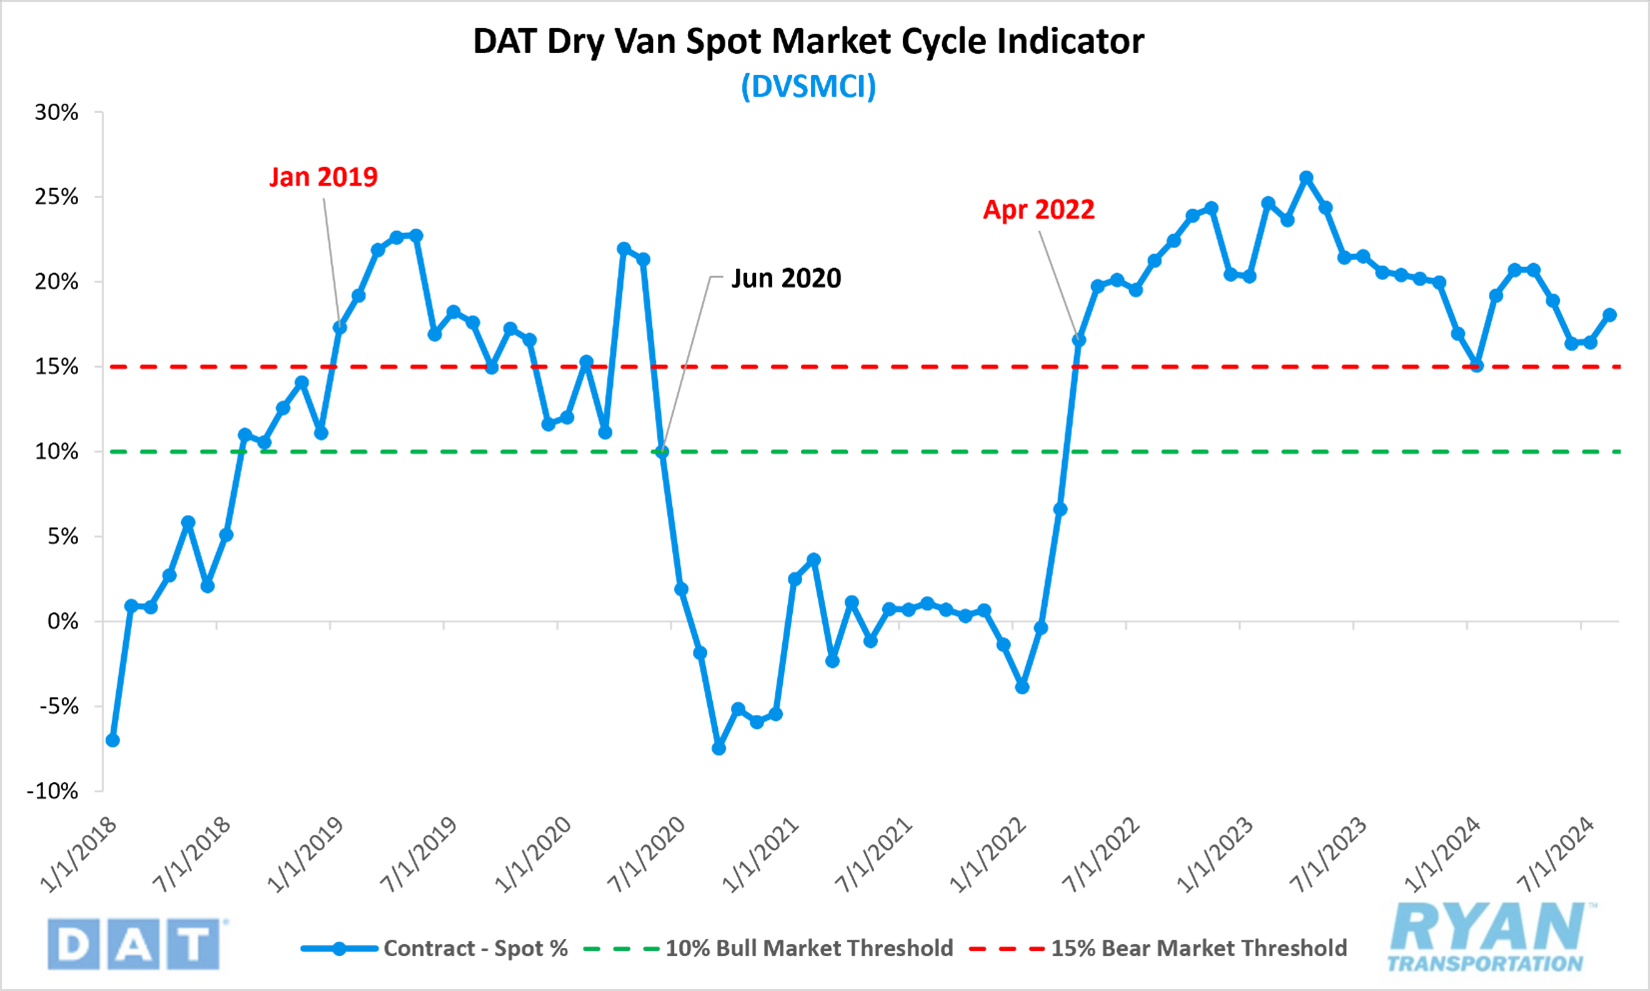
However, the semblance of hope for the remainder of the year is not without its caveats. Average spot linehaul rates continue to trend in line with the over-capacitated market of 2019, which ultimately saw rates drop below their August levels throughout much of Q4. Another downside coming from the data in August was the widening gap of current rates below the LT average. After narrowing the margin to 3.6% in June, the second lowest level in 2024, the difference has been trending negatively since. Similarly, the DAT Dry Van Spot Market Cycle Indicator (DVSMCI), a good indicator of the current market cycle measured by calculating the difference between spot and contract rates as a factor of their average, increased from 16.5% in July to 18.1% in August.
According to Jason Miller, Interim Chair of the Department of Supply Chain Management at Michigan State University and creator of the index a ratio above 15% indicates a bear market while a ratio below 10% suggests a bull market.