Back to September 2024 Industry Update
September 2024 Industry Update: Truckload Supply
Tender rejections reflected continued contractions in supply as it searches to balance out with demand, but indicated further reductions are required to effect any meaningful change in the market.
Key Points
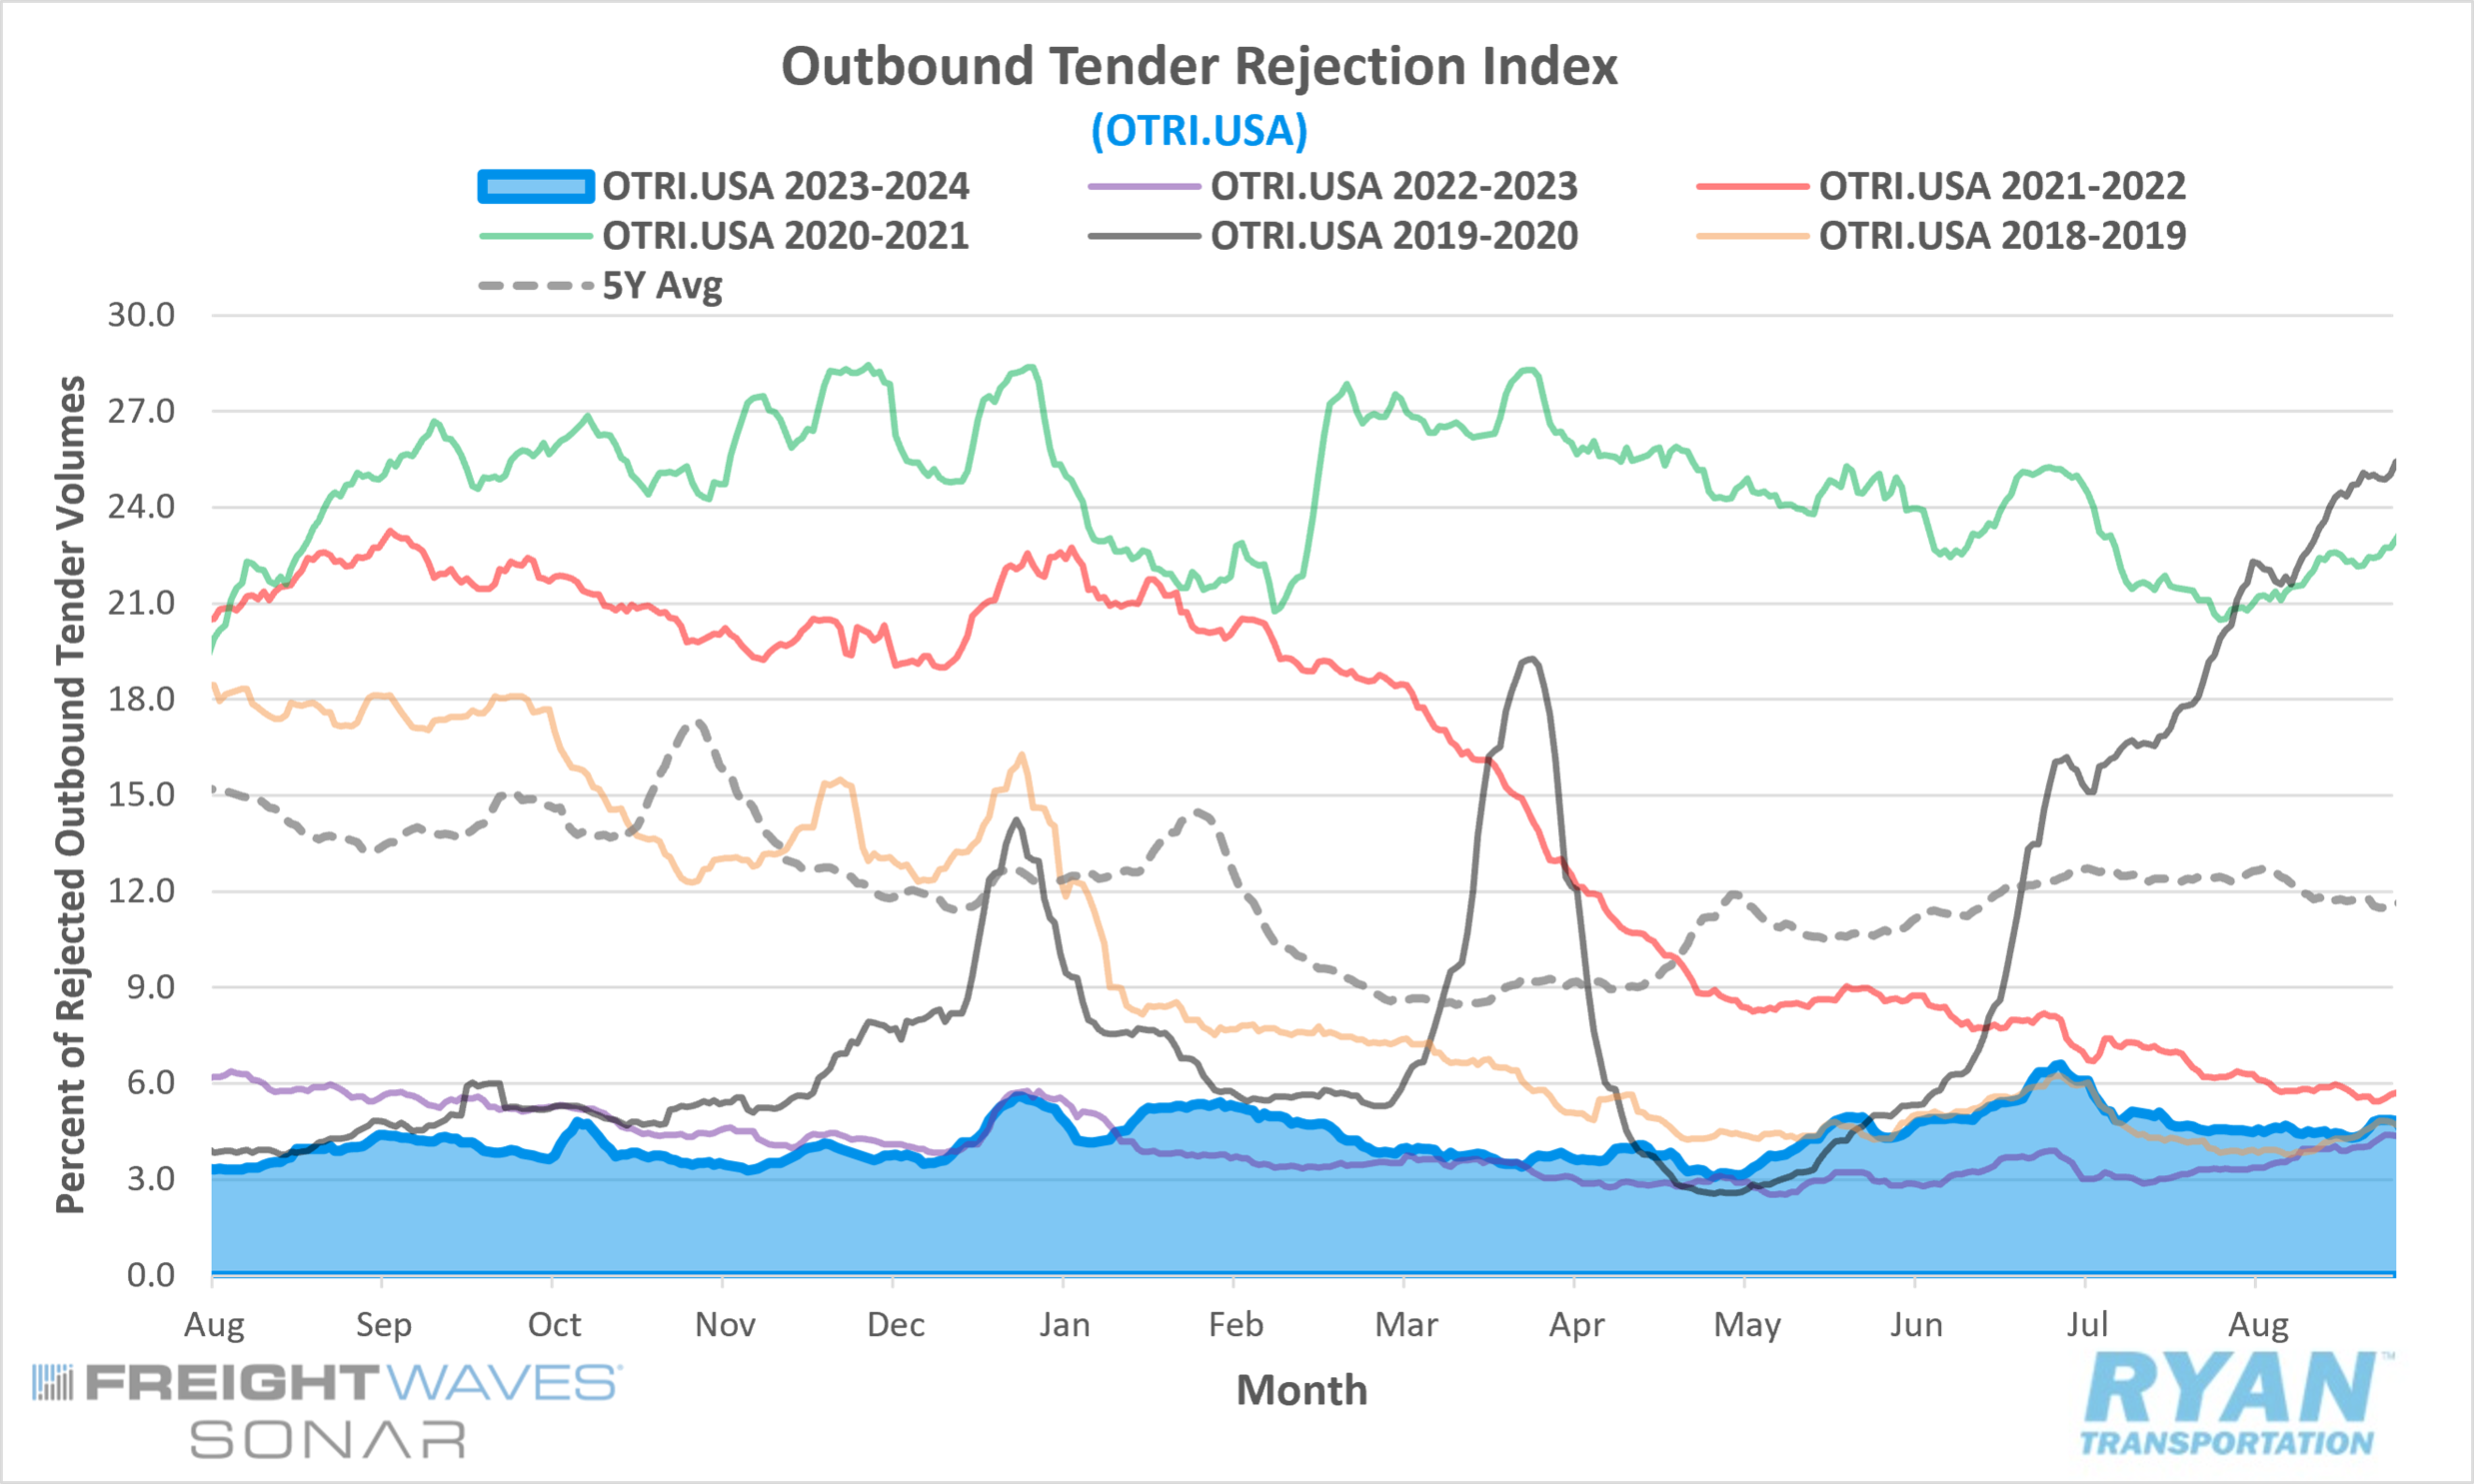
- The FreightWaves SONAR Outbound Tender Rejection Index (OTRI.USA), a measure of relative capacity based on a carriers’ willingness to accept freight volumes under contract reflected as a percentage, registered a 0.3% increase MoM at the end of August compared to the end of July.
- The monthly average of daily tender rejections in August was 0.7% lower MoM compared to July, declining from 5.2% to 4.5%.
- On an annual basis, average daily tender rejections were up 0.8% YoY compared to August 2023 but remain 7.2% below the 5-year average.
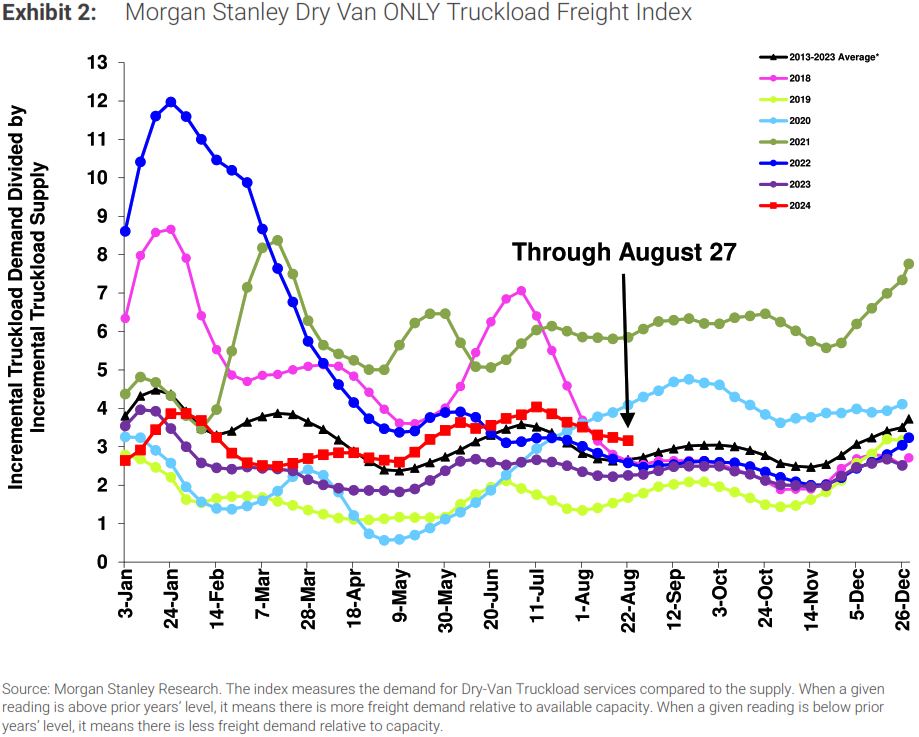
The Morgan Stanley Truckload Freight Index (MSTLFI) declined sequentially throughout August and underperformed typical seasonality, but still remains above the LT average.
Summary
According to data from FreightWaves SONAR’s Outbound Tender Rejection Index (OTRI), outbound tender rejections remained relatively stable throughout August following a downward trend observed during much of July. After falling below the 5% mark in mid-July, rejection rates stabilized at the beginning of August, averaging around 4.5% for most of the month. The index experienced some volatility at the start of the final week, dropping to its lowest point for the month of 4.3% before rising by nearly 60 basis points to just under 4.9% immediately before Labor Day. End-of-month comparisons are somewhat distorted due to the holiday’s impact. However, mid-month comparisons show that tender rejections in August were 70 basis points lower than at the midpoint of July.
On an annual basis, tender rejection rates remained slightly above 2023 levels and continued to align closely, albeit marginally higher, with the levels recorded in 2019. Although YoY comparisons remained positive, the differential narrowed significantly in August for the first time in five months. Since March, the gap between the monthly average of daily tender rejections in 2023 and 2024 has steadily increased, rising from 0.2% to 2% in July before decreasing to 0.8% in August. In comparison to 2019, average tender rejections were 45 basis points higher in August, representing the largest differential recorded this year.
The most recent Morgan Stanley report attributes the index’s underperformance in August primarily to the demand component. Survey responses from shippers indicated a slowdown in orders due to the pull-forward of typical peak season activity. While demand weakened, the supply component of the index shifted from a period of significant underperformance at the beginning of August to levels more aligned with seasonality by the end of the month. The report also highlighted instances of market tightness in certain regions, while imbalances persisted elsewhere. The index has remained above the previous year’s levels since mid-January and above the long-term average since mid-April, suggesting that supply contractions continue to drive the market towards equilibrium.
Why It Matters
The continued contraction of supply remains evident in the data, as tender rejections hovered around 4.5% throughout the doldrums of summer. While this represents an improvement from the sub-4% levels recorded earlier this year, significant progress is still required before conditions can begin to stabilize. The persistence of excess capacity was most apparent in the absence of substantial upward movement in the index during the week leading up to Labor Day weekend. Had tender rejections risen to the levels observed around the Fourth of July, it would have suggested that the capacity situation was becoming increasingly more fragile than anticipated.
The direction of the rejection index over the coming months will be important in assessing the extent of the remaining excess supply. In recent months, rejection rates have closely mirrored those recorded in 2019. During that year, steady declines in rejection rates following the Fourth of July extended into August, after which the index began a positive trend that culminated in a surge to double digits by December. However, in August, the rejection index also moved closer to the levels seen last year, with rates remaining relatively stagnant, around 4%, in the later months before slightly exceeding 4.5% in December. If rejection levels align with the trend observed in 2023, it will indicate that further capacity reductions are necessary to achieve any sort of meaningful shift.