
Executive Summary
As we enter the second half of 2024, the outlook for both the transportation industry and the overall economy remains unclear, with mixed signals continuing to blur the lines between cautious optimism and prudent pessimism.
The U.S. economy saw a slight improvement in the first quarter GDP, revised upward from 1.3% to 1.4% in the third data release. This increase was driven by positive revisions in key components such as equipment investment, structures investment, housing and government purchases. However, these gains were partially offset by a concerning downward revision in consumption estimates, which fell from 2% to 1.5%. Domestic manufacturing continued to contract in June because of weak demand and high interest rates, which curtailed further investments.
Additionally, the labor market, which has been a cornerstone of economic strength, is showing signs of instability. The gap between establishment and household surveys is widening, with establishment data estimating an employment rise of 206,000. However, after downward revisions to April and May figures, the net gain totaled only 95,000.
In the transportation sector, truckload conditions improved for the second consecutive month, yet have not reached a level that suggests a near-term recovery. Resilient freight demand, coupled with capacity exits, allowed spot rates to increase for the second month in a row, while contract rates remained stable.
The decline in the carrier population is ongoing but has significantly slowed since its peak in the fourth quarter of last year. While strong import levels have helped offset weaker-than-expected produce volumes in June, this trend does not appear sustainable in the long term as shippers increasingly adopt leaner inventory management solutions.
Main Takeaways
- Economy: U.S. manufacturing activity slowed for the third consecutive month, with weak demand, declining output and continued accommodative inputs.
- Truckload Rates: Average spot rates increased for a second consecutive month in June while contract rates remained steady, further narrowing the contract-to-spot spread.
- Truckload Demand: Freight demand remained resilient in June, driven by growth in dry van volumes and strong imports.
- Truckload Supply: Truckload supply levels continued to contract as tender rejections surged to a near two-year high.
- Truckload Capacity Outlook: The carrier population continued to decline in June but at a much slower rate than previous months.
- Fuel: The national average price of diesel fell for a fourth straight month in June as excess global supply continued to outpace weak demand.
- OTR By Mode
- Dry Van: Dry van volumes surged in June, causing spot rates to increase for the second consecutive month.
- Reefer: Refrigerated rates increased despite weaker than expected produce volumes.
- Flatbed: Average flatbed spot rates ticked up slightly in June but were well below seasonal averages as volumes continued to struggle.
- Intermodal: Intermodal traffic continued to register annual gains in June while competition with the weak truckload market kept rates deflated.
Industry Overview
June Key Figures (YoY)
| Truck Data Points | YoY% Change |
| DAT Spot Rates (incl. FSC) | -2.0% q |
| Fuel Prices | -2.1% q |
| ACT Class 8 Preliminary Orders | -11.8% q |
| ATA NSA Truck Tonnage* | 1.4% p |
| Cass Freight Index** | -2.4% q |
| Cass Freight Expenditures | -9.4% q |
| Cass Freight Shipments | -6.0% q |
*Report released 6/18/24
**Report released on 6/17/2024
Economy
United States ISM Manufacturing PMI
Key Points
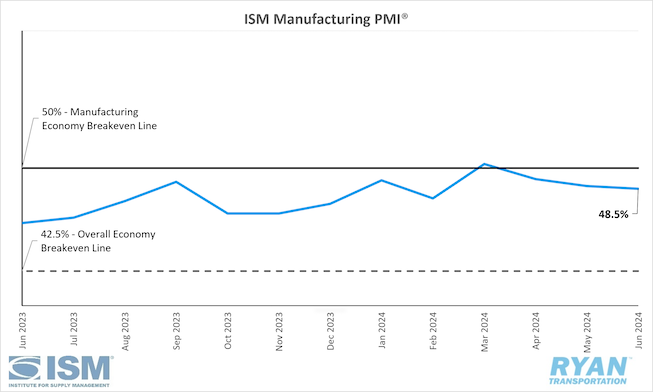
- The ISM Manufacturing PMI® registered 48.5% in June, 0.2% lower than the 48.7% reading in May, and remains in contraction territory.
- The New Orders Index remained in contraction territory, registering 49.3% in June, 3.9% higher than the 45.2% registered in May.
- The Production Index was down 1.7% in June to 48.5% and moved back into contraction territory.
- The Employment Index registered 49.3% in June, 1.8% lower than the 51.1% recorded in May.
- The Prices Index dropped 4.9% in June from May’s reading of 57% to 52.1%.
Summary
In June, manufacturing activity in the United States experienced a further deceleration, with the ISM Manufacturing PMI® contracting for the third consecutive month. Demand remained weak during this period, while output declined and input conditions remained accommodative. Despite this, the June Manufacturing PMI® indicated continued economic expansion, marking 50 consecutive months of growth following a single month of contraction in April 2020.
The demand components of the composite index, primarily measured by the New Orders, Backlog of Orders and Customers’ Inventories indices, continued to reflect softening demand conditions in June. Although new orders showed a marginal improvement after a sharp contraction in May, this was insufficient to move the index out of contraction territory for the third consecutive month. According to the latest ISM® report, the New Orders Index has not shown consistent growth since its 24-month streak of expansion ended in May 2022. Additionally, the Backlog of Orders Index fell deeper into contraction, reaching its lowest level since January 2023, when it registered 41.4%. Customers' inventories returned to the low side of the “just right” territory, serving as a neutral indicator for future production.
The output components, as measured by the Production and Employment indices, declined compared to May, resulting in a combined 3.5% downward impact on the Manufacturing PMI® calculation. After three months in expansion territory, the Production Index moved back into contraction, with companies slightly reducing output levels compared to May. On the employment front, following a brief expansion in May that ended a seven-month streak of contraction, the index returned to contraction territory. According to ISM® reports, companies continue to reduce headcounts through layoffs, attrition and hiring freezes, with the hiring-to-headcount reduction ratio registering approximately 1.3-1 in June.
The input components, primarily defined by supplier deliveries, inventories and prices, continued to support future demand growth in June. The Prices Index experienced the most significant movement, with prices cooling for the second consecutive month but still expanding at a slower rate compared to the previous month. June marked the sixth consecutive month of raw material price increases following eight months of decreases. According to the ISM® report, suppliers continue to have capacity with improving lead times and less severe inventory shortages.
Why it Matters:
The June reading of the ISM Manufacturing PMI® continued to disappoint those anticipating a near-term rebound in domestic manufacturing activity. Persistently weak demand and uncertainty surrounding future monetary policy remain the primary deterrents for further company investment in employment and inventories. This has led to a reduction in output in June compared to May, likely causing revenue declines and exerting further pressure on profitability.
While the recent ISM® report did little to inspire confidence in the near-term outlook, Timothy Fiore, Chair of the Institute for Supply Management® Manufacturing Business Survey Committee, remains cautiously optimistic. Fiore notes that the index has remained stable over the past 12 months, a marked improvement compared to previous volatility. Additionally, the June report indicated steadiness in the Employment Index. Despite dipping into contraction, survey comments favored hiring over staff reductions. Although companies are refraining from investing in working capital, there have been no widespread layoffs, which are typically the quickest and easiest way to reduce expenses.
However, Fiore acknowledges that the current demand environment and elevated interest rates have created a challenging situation. Without an increase in demand or a significant reduction in interest rates, it is unlikely that the trajectory of the index will change over the next three months. Among the six largest manufacturing industries—Chemical Products, Transportation Equipment, Food, Beverage & Tobacco Products, Computer & Electronic Products, Machinery and Fabricated Metal Products—only Chemical Products reported growth in June.
Macro Economy
- Total nonfarm payroll employment rose by 206,000 jobs in June following significant downward revisions to April and May figures, according to the most recent employment situation report released by the Bureau of Labor Statistics (BLS).
- The unemployment rate rose by 0.1% MoM in June to 4.1%, its highest level since November 2021.
- Total Transportation and Warehousing employment added 7,300 jobs in June on a seasonally adjusted basis.
- Truck Transportation was essentially unchanged in June, although prior months saw downward revisions.
- Warehousing and Storage employment declined by 2,300 jobs in June on a seasonally adjusted basis.
- The headline Personal Consumption Expenditures (PCE) Prices Index remained unchanged in May from April while core PCE, the Fed’s preferred gauge for measuring inflation, registered a 0.1% increase MoM on a seasonally adjusted basis in May, according to the most recent report by the Bureau of Economic Analysis (BEA).
- On an annual basis, both headline and core, which excludes food and energy, increased 2.6% in May on a seasonally adjusted basis.
Truckload Rates
Spot Rates
Key Points
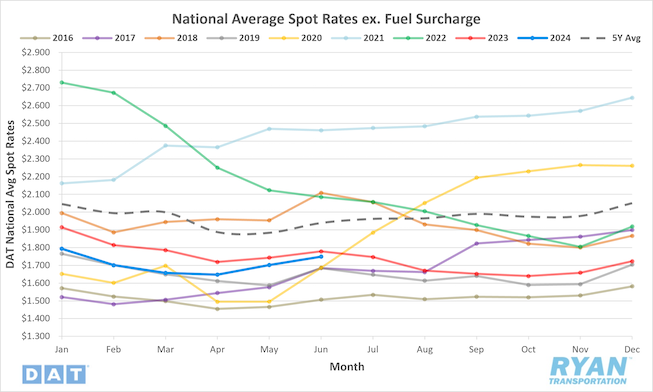
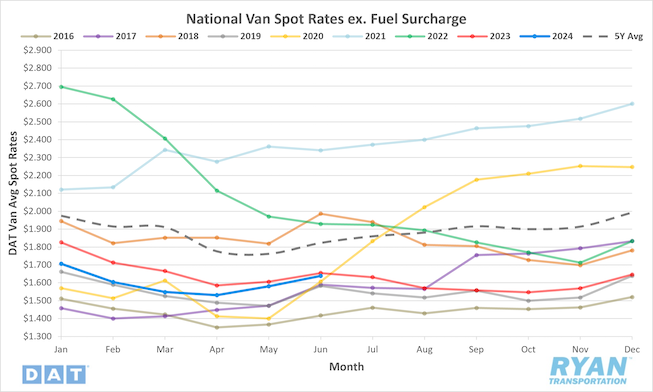
- The national average spot rate excluding fuel increased 2.8% MoM, or just under $0.05, in June to $1.75.
- Compared to June 2023, average spot linehaul rates were 1.7% lower YoY and sit 9.8% below the 5-year average.
Contract Rates
Key Points
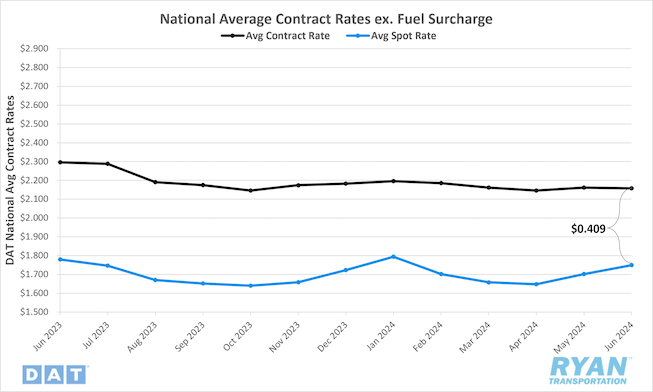
- Following upward revisions of final reported contract rates in May, initially reported contract rates not inclusive of fuel were virtually unchanged in June, dropping 0.2% MoM, or just under $0.01.
- On an annual basis, average contract linehaul rates were down 6.0% YoY in June.
- The contract-to-spot spread narrowed further in June, moving from $0.46 in May to $0.41.
Summary
Average spot rates extended their upward trend in June for the second consecutive month but fell short of the typical seasonal boost usually observed during this period. Although the increase in summer shipping volumes exerted additional pressure on capacity, the 2.8% rise in spot rates was below the 4.4% seasonal average MoM increase and the 5.2% average MoM increase seen in pre-pandemic years. However, annual comparisons have continued to improve throughout the year, with June recording the lowest YoY differential since the current cycle's downturn, at 1.7%.
In the absence of significant capacity disruptions like those seen in May, average spot linehaul rates, as recorded by the DAT 7-day linehaul spot rate index, showed little change WoW in June. After weekly rates surged by $0.12 in the latter half of May, the 7-day rolling average began June at an elevated level comparable to previous months. As drivers returned to the road following the long Memorial Day weekend, the index recorded just under a $0.03 WoW decline in the first week, followed by another $0.02 WoW drop in the second week, settling at $1.77. The 7-day index remained at that level for the rest of June, ending the month $0.09 higher than at the start of May.
While spot rates remain volatile as they seek a bottom, longer-term contract rates stabilized in June. Contract rates, which generally exclude a fuel surcharge, have remained within a narrow range this year, with the average monthly change over the past six months registering just under $0.01. The stability of contract rates amid rising spot rates has narrowed the contract-to-spot spread to its lowest point since January, when winter weather caused a surge in spot rates. Before this, the previous low in the contract-to-spot spread occurred in March 2022 ($0.205), when market conditions first began to deteriorate.
Why It Matters:
Considering the state of spot rates over the past two years, it is challenging not to view the consecutive increases over the past two months as indicative of underlying market shifts. The rise in spot rates, coupled with declining fuel prices, likely provided much-needed relief for carriers operating on razor-thin margins. However, this trend may also foster optimism that market conditions are improving, potentially delaying the exit of excess capacity. While part of the rate increase results from ongoing capacity reductions, numerous data points indicate that a significant market inflection point has not yet been reached.
The increase in the monthly average spot rate in June can be primarily attributed to the spike in rates caused by the International Roadcheck and the Memorial Day holiday. Similar to last year, the impacts on capacity from these events reset the rate baseline heading into the summer shipping season. According to the DAT 7-day linehaul index, rates were $0.14 higher at the start of June compared to the beginning of May. Although rates contracted somewhat as drivers returned to the road, additional demand from summer goods shipping, holiday promotions and end-of-quarter needs mitigated the extent of these declines.
While spot rates remain volatile, the stabilization of contract rates in the first half of the year likely signals that they have reached their floor. The aggressive rate reductions that began in 2022 and continued through 2023 are largely behind us, as several publicly traded carriers have resisted further concessions. With contract rates bottoming out, longer-term contracts are expected to regain favor as shippers seek to secure discounts for extended periods. Consequently, service level prioritization will once again become the primary focus for shippers with the resurgence of long-term contracts.
Truckload Demand
Key Points
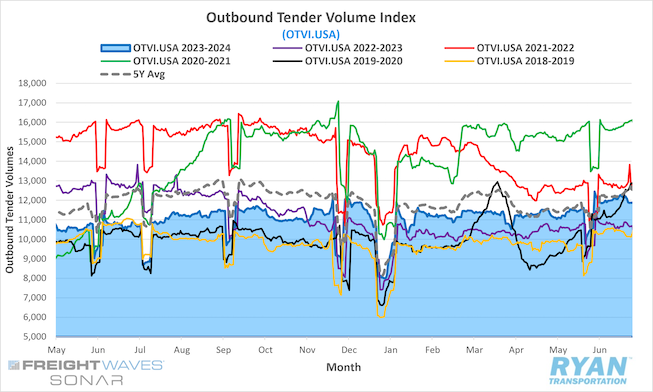
- The FreightWaves SONAR Outbound Tender Volume Index (OTVI.USA), a measure of contracted tender volumes across all modes, registered 12.9% higher at the end of June compared to the end of May, rising from 10,518.87 to 11,880.53.
- The monthly average of daily tender volumes in June was 7.1% higher MoM compared to May, increasing from the 11,153.69 average in May to 11,947.07 recorded in June.
- Average daily tender volumes recorded by the FreightWaves SONAR OTVI in June were 12.3% compared to the average in June 2023 and were 1.1% lower than the 5-year average.
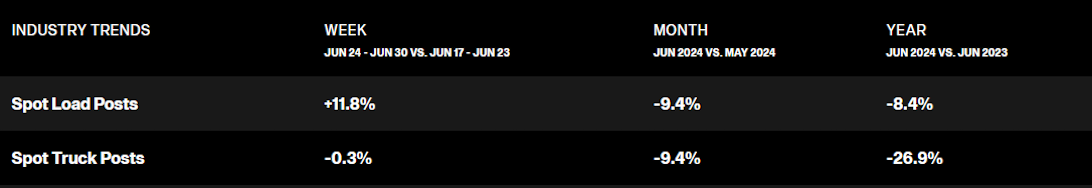
- After spot market activity jumped considerably in May from the numerous capacity disruptions, spot volumes tapered off in June, falling 9.4% MoM and remaining 8.4% below the previous year’s levels.
- The Cass Freight Index Report, which analyzes the number of freight shipments in North America and the total dollar value spent on those shipments, declined on a monthly basis for both shipments and expenditures by 1.8% and 3.0%, respectively, with both registering lower compared to last year by 6.0% and 9.4%, respectively.
Summary
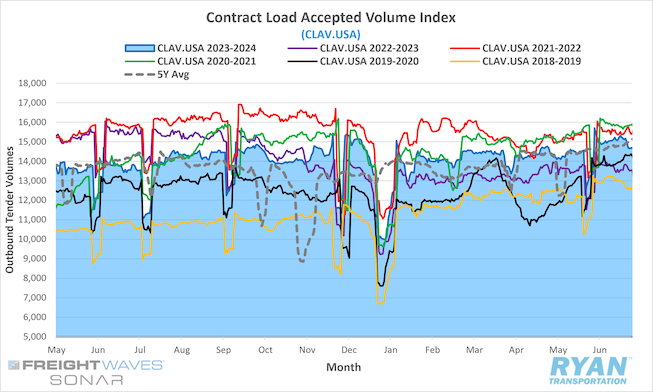
The stability and resilience in freight volumes observed during the first five months of the year continued into June. Tender volumes, as recorded by the SONAR Outbound Tender Volume Index (OTVI), rebounded following the post-Memorial Day lull, with the index increasing nearly 14% in the first two weeks of June compared to the start of the month. Adjusting for the holiday static, mid-June volumes were up 5.1% from mid-May levels. Year-over-year comparisons show the OTVI up 10.5% at mid-June and closing the month 11.5% higher than June 2023. While the OTVI provides insight into shippers' capacity requests, the data can be artificially inflated due to load rejections and re-tendering. The FreightWaves SONAR Contract Load Accepted Volume Index (CLAV.USA), which excludes tender rejections, increased roughly 4% MoM by mid-June and stands 8.6% higher YoY, indicating that freight volumes are continuing to recover.
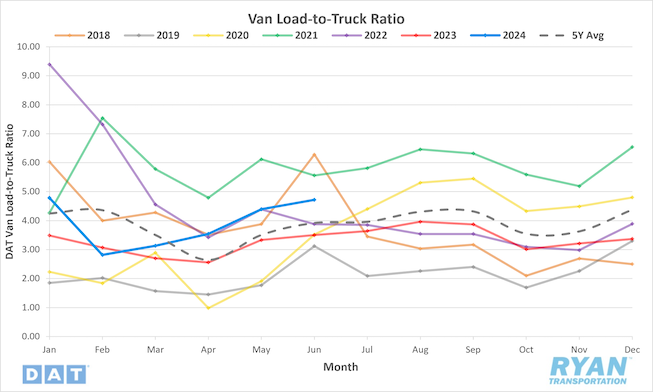
A closer examination reveals that demand growth in June was widespread across the country, with SONAR reporting overall growth in more than half of their 135 key market areas. However, from a modal perspective, volume growth primarily stemmed from increased dry van demand along with minor increases in refrigerated activity, according to data from both FreightWaves SONAR and DAT. The FreightWaves SONAR Van Outbound Tender Volume Index (VOTVI.USA) recorded a 4% MoM increase in June and was up just over 12% compared to June 2023. DAT also noted a surge in dry van demand in the final week of June, pushing the monthly average load-to-truck ratio 7.5% higher MoM and 35% above June 2023 levels. Both sources reported slight increases in refrigerated activity but noted underperformance in this sector due to weak produce volumes from the West Coast.
In the current truckload environment, contract freight continues to dominate, with spot market volumes declining by just over 8% in June compared to May. The absence of capacity-disrupting events in June, unlike the previous month, reduced the need for shippers to seek capacity outside their normal routing guides. The most recent American Trucking Association’s (ATA) Tonnage Index, which primarily measures truckload and less-than-truckload (LTL) contract freight with minimal spot volumes, further supports the stronghold of the contract market over current freight volumes. According to the latest report in June, the seasonally adjusted ATA Tonnage Index increased 3.6% MoM in May compared to April and was 1.5% higher YoY, marking the first YoY increase in the last 15 months. This indicates that not only are volumes improving, but they continue to flow primarily through the contract market rather than the spot market.
Why It Matters:
While the annual gains in demand are a positive indicator that the economy is not yet recessive, the growth in volumes has yet to benefit service providers due to excess capacity. Despite remaining robust through the first two quarters of 2024, the current rate of demand growth is not enough to rebalance the market. According to experts, the current oversupply levels would require a significant demand shock to shift purchasing power back in favor of carriers. That remains unlikely, though, as indicators of industrial and retail activity do not appear to be at a point to push levels higher.
Analysts attribute the demand observed so far this year to two primary factors. First, the substantial reduction in inventory levels from last year, when companies faced challenges offloading over-ordered products from the pandemic period. Second, the continued strength in imports, driven either by customers pulling forward import orders or reacting to deteriorating service levels from ocean carriers. However, given that imports generally account for only about 5% of overall truckload moves, the longevity of these impacts is questionable, particularly as retailers continue to maintain leaner inventory levels.
Truckload Supply
Key Points
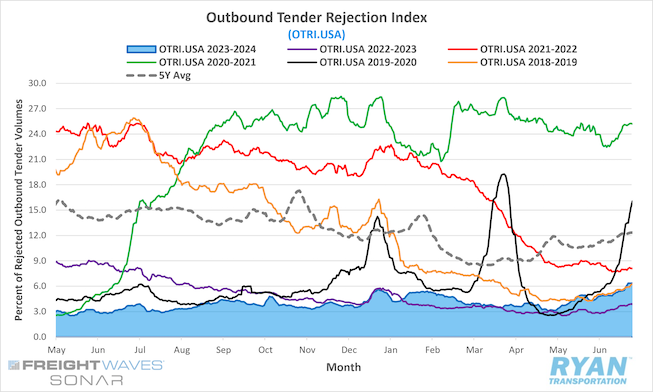
- The FreightWaves SONAR Outbound Tender Rejection Index (OTRI.USA), a measure of relative capacity based on carriers’ willingness to accept freight volumes under contract reflected as a percentage, registered a 2.04% increase MoM to close out June compared to the end of May.
- The monthly average of daily tender rejections registered 5.16% in June, a 1.1% increase over May’s average of 4.06%.
- Compared to June 2023, average tender rejections were 1.9% higher but remain 4.57% below the 5-year average.
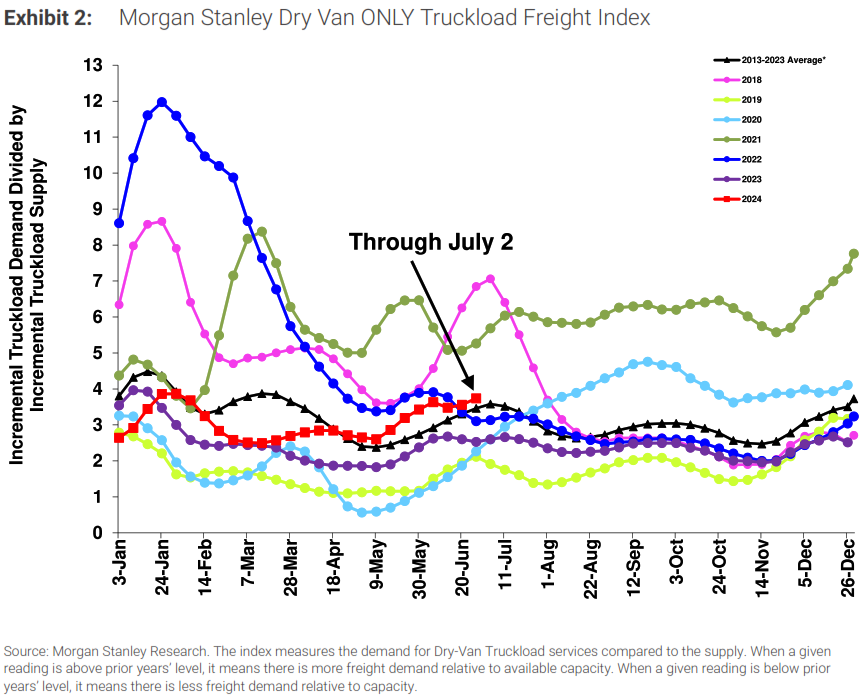
- The Morgan Stanley Truckload Freight Index (MSTLFI) registered sequential increases in the back half of June after decreasing sequentially in the front half of the month and remained above the long-term average.
Summary
Despite the challenges posed by excess supply, June's data signals that capacity exits are beginning to provide a foundation for market recovery. Following a near 5% mark in the final week of May, tender rejections lost momentum during the post-Memorial Day lull, dropping to 4.3% at the start of June. However, similar to volumes, this brief respite was short-lived as rejection rates surged in the first full week of June, increasing nearly 60 basis points (bps) from the beginning of the month. After a brief stall in the second week, tender rejections spiked again in the latter half of June, rising 147 bps by the end of the month to reach their highest level since early August 2022. At 6.35%, the SONAR Outbound Tender Rejection Index was just over 2% higher than 30 days prior and nearly 2.5% higher than the levels recorded at the end of June last year.
The steady increase in rejection rates since the second quarter of last year indicates that capacity is approaching a point of correction. The June monthly average of daily tender rejections (5.16%) is the highest since September 2022 (5.41%) and was 155 bps higher than the overall average for 2023. Although still below the long-term average, June marked the smallest differential between current and 5-year averages at 4.57% since the index's inception in March 2018.
The most recent Morgan Stanley Truckload Freight Index (MSTLFI) report further supports the contraction of excess supply levels in June. According to the report, the supply component of the index continued to decline sequentially and outperformed typical seasonality, indicating that supply is exiting the market at an accelerated pace. The MSTLFI remains above both the previous year’s levels and the long-term average, suggesting that supply is contracting faster than demand is growing. Although the demand component registered sequential increases in June, its underperformance relative to typical seasonality contributed to the overall index's underperformance.
Why It Matters:
The resurgence of tender rejections in June, absent any capacity-disrupting events, is a strong indicator of underlying market shifts. The substantial increase that pushed the index to a near two-year high suggests that supply levels may be contracting faster than anticipated. To contextualize the significance of June's rise in rejections, the 1.8% increase in tender rejections from 3.1% in early May to the pre-Memorial Day peak of 4.9% is notable, as such a jump has not occurred outside the Christmas period since the early pandemic boom. Considering that Memorial Day and June generally have less impact on capacity compared to Christmas, last month's movement in the Outbound Tender Rejection Index (OTRI) is significant.
Despite the notable performance of rejection values in June, there are important caveats. Similar to spot rates, the effects of International Roadcheck and Memorial Day reset the baseline to a higher level for June. It is also not unusual for rejection rates to rise in June, given the historical average month-over-month (MoM) increase of 6.2% for this month. However, tender rejections have started to resemble values recorded in 2019, the last major industry recession year. During that period, rejection rates nearly reached 15% around the holidays, a significant increase compared to the past two holiday seasons, which remained below 7%. While there is still potential for further supply contraction, the timeline for such adjustments may be shorter than some expect.
Truckload Capacity Outlook
Key Points
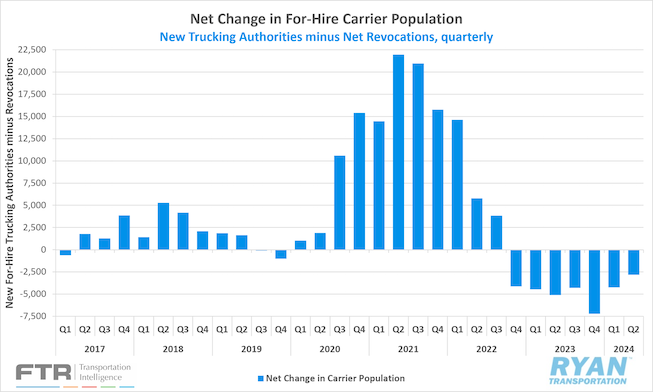
- Total net revocations, a measure of total authority rejections minus reinstatements, fell slightly MoM in June by just 260 carriers, dropping from 5,509 revocations in May to just below 5,250 in June, according to FTR’s preliminary analysis of the Federal Motor Carrier Safety Administration’s (FMCSA) data.
- The number of newly authorized for-hire trucking companies declined by 620 carriers in June after increasing slightly in May, falling from just over 5,200 new authorizations in May to 4,629 authorities in June, per FTR’s reporting.
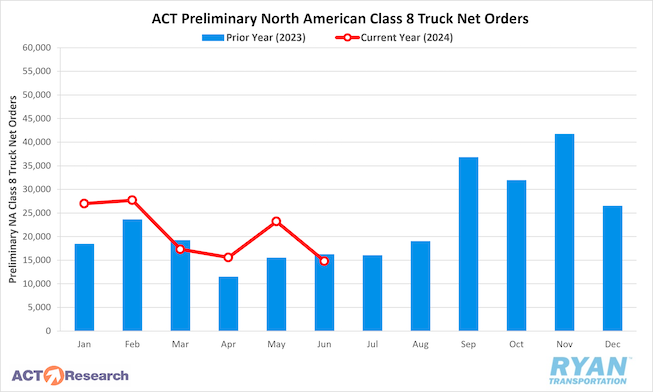
- Preliminary North American Class 8 Orders in June ranged from 13,100 units as reported by FTR to 14,800 units according to ACT Research, with both estimates registering lower annually by 6% and 12%, respectively.
Summary
The carrier population continued its negative trajectory in June, with a decline of 620 carriers as net revocations outpaced new entrants. This decrease brings the net reduction in active for-hire trucking firms to 2,821 for the second quarter of 2024, marking the smallest quarterly decline since the downturn began in the fourth quarter of 2022. Compared to the peak of 7,204 carriers in the fourth quarter of last year, the total net decline in the second quarter of 2024 has decreased by nearly 61% and is 45% lower than the same quarter in 2023, which saw a net decline of 5,109 carriers.
While net revocations remain historically elevated, they have slowed since reaching a peak in the first quarter of 2023, when 24,079 authorities were revoked. With 17,588 in the second quarter of 2024, total net revocations were their lowest since the first quarter of 2022 and represented a 23% decrease from the second quarter of 2023. Meanwhile, newly authorized for-hire trucking firms have begun to increase slowly since reaching a low point of 12,967 in the fourth quarter of last year. Although the second quarter of 2024 marked the second consecutive quarterly increase in new authorizations, the levels remain below those of any quarter between the fourth quarter of 2020 and the third quarter of 2023, according to FTR.
Turning to equipment, preliminary Class 8 orders in June were at the lower end of typical market results but aligned with seasonal expectations, according to reports from both FTR and ACT Research. While monthly declines were recorded by both sources sequentially, June marked the first instance in 2024 where order levels were lower on an annual basis. According to FTR, despite a slowdown from an average of 18,000 units in the first quarter to 16,000 units in the second quarter, Class 8 orders have remained strong over the last five months, averaging a 25% annual increase. FTR also highlighted a notable decrease in vocational market demand in June based on preliminary figures, though orders still exceeded replacement levels.
Why It Matters:
The recent slowdown in the decline of the carrier population over the past few months is notable given the lack of significant improvement in market conditions during this period. While no single explanation definitively accounts for this trend, several theories have been proposed to explain why capacity is not exiting the market more rapidly. One theory, previously mentioned in our updates, suggests that the downturn has already culled the weakest operators by the end of 2023.
Data from the FMCSA indicates that newer authorities and smaller operations with 1-2 trucks, likely more exposed to spot market conditions, continue to comprise the majority of monthly revocations. Another theory posits that surviving operations are becoming cautiously optimistic about a potential near-term recovery, particularly as rates have shown positive trends over the past two months, encouraging them to persevere through the current challenges. Additionally, industry sources suggest that older drivers may be delaying retirement and continuing to drive due to the rising cost of living.
While fluctuations in active for-hire trucking authorities provide valuable insights into market dynamics, they do not fully capture actual changes in capacity. Payroll data collected by the Bureau of Labor Statistics (BLS) for its jobs report offers a more comprehensive view, as employer firms—accounting for approximately 80% of total truck transportation revenue annually—are included. According to the latest jobs report, the truck transportation sector experienced a seasonally adjusted decline of 100 jobs in June, marking the smallest increase reported by the BLS.
This decline follows downward revisions for March and April, with May's revised figures showing a loss of 6,100 jobs (up from the originally reported 5,400 decline), and April's final figures reflecting a loss of 1,600 jobs (compared to the initially reported drop of 900 jobs). The stability observed in truck transportation jobs in June likely reflects expectations of increased spot rates during the summer shipping season. However, this stability is expected to be short term amid ongoing volatility and market oversaturation.
Fuel Prices
Key Points
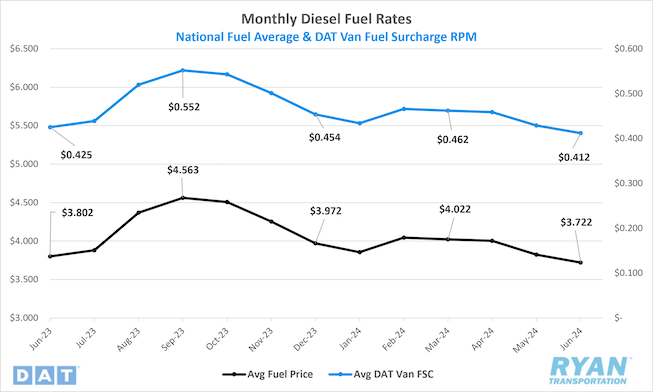
- The national average price of diesel fell further in June, dropping 2.6% MoM, or $0.10, from $3.822 in May to $3.722.
- Compared to the same month last year, average diesel prices were 2.1%, or $0.08, lower in June 2024.
- Draws on U.S. Crude Reserves outpaced builds but underperformed expectations in June, with the net change in commercial crude stocks registering -7.38M bbls versus the consensus of -10.09M bbls for the weeks ending June 7 and June 28.
Summary
The national average price of fuel extended its decline in June for the fourth consecutive month, decreasing by an additional $0.10 MoM. Fuel prices have now fallen in 15 of the last 19 months, with YTD declines totaling $0.25. Throughout the first two weeks of June, national average diesel prices continued their downward trend, dropping by $0.10. However, this streak was interrupted in the third week when diesel prices saw a $0.077 increase, marking the first rise since early April and the largest week-over-week (WoW) increase since February 12. Benchmark prices continued to rise heading into the final week of the month, ending $0.034 higher WoW and $0.011 above their starting point for the month. June's national average retail price of diesel reached $3.722, the lowest level since December 2021. when it stood at $3.641.
As anticipated for the summer travel season, U.S. crude inventories in June showed a pattern of draws that outpaced builds but fell short of expectations. A significant factor in this underperformance was a surprise build of 3.7M bbls in crude inventories for the week ending June 7, attributed to the highest crude imports since August 2019, as reported by Reuters. Concurrently, U.S. distillate inventories rose to 114M bbls during the same week, the highest since February and just below the 114.6M reported in June 2019. In response to declining fuel prices and elevated stockpiles, U.S. energy firms reduced the number of active oil and gas rigs to 590 by the second week of June, the lowest count since January 2022, according to Baker Hughes. Following this development, U.S. oil futures trading turned positive, as the active rig count serves as an early indicator of future production levels.
Why It Matters:
The consistent decline observed from May through June indicates an ongoing supply-side imbalance in global oil markets, though late June indicators have shifted towards a more bullish outlook for the remainder of the year. Despite the typical peak in demand during summer travel months, the recent price drops over the past two months are unusual. These declines have been largely attributed to elevated U.S. production levels, which have persisted around 13.1 million barrels per day following a peak of 13.3 million barrels per day in February, as reported in the weekly production update from the EIA. Industry experts note these efforts may be stalling as more active rigs are being taken offline. Current projections suggest U.S. production can sustain these levels for approximately another six to nine months before encountering challenges.
While the U.S. aims to keep global prices subdued, several opposing factors are now tilting the near- to mid-term outlook towards higher oil prices. A significant factor bolstering prices is the resurgence of geopolitical risks, particularly tensions escalating between Israel and Hezbollah, an Iranian-backed militant group based in Lebanon, potentially threatening global supply levels. Additionally, recent economic data from China, the world's largest oil importer, indicates a robust growth in manufacturing activity throughout the first five months of the year, further supporting oil demand.
The factors contributing to price spikes seen in late June, including geopolitical tensions and strong demand from China, echo issues recurring in the current price cycle. These efforts have aimed to halt declines and stimulate growth, resulting in short-term market rallies. However, they have not yet fostered sustained long-term growth due to persistent challenges such as weakening manufacturing activity, persistent inflation and high interest rates, which continue to constrain demand.
Dry Van Overview
Spot Rates
Key Points
- The national average dry van spot rate excluding fuel increased 4.2% MoM, or just below $0.07, in June to $1.65.
- Compared to June 2023, average dry van spot linehaul rates were 0.4% lower YoY and sit 9.6% below the 5-year average.
- Initially reported average dry van contract rates exclusive of fuel changed little in June, dropping 0.8% MoM, and were 7.3% lower than June 2023 levels.
Load-to-Truck Ratio
Key Points
- The dry van load-to-truck ratio (LTR) registered 4.72 in June, a 7.5% increase over May and 34.9% higher compared to June 2023.
Market Conditions
Dry Van Summary
June marks the initial wave of produce harvest and distribution throughout the southern U.S. in many coastal states. Florida, Georgia, Texas, Louisiana and California farmers need to move their products from their fields and onto shelves of grocery stores across the nation. This influx of demand makes June a hotbed for dry van capacities. Along with produce, the movement of household goods across the U.S. ramps up substantially beginning in June and running through July.
DAT reported that dry van spot rates hover about $0.05/mile above 2019; however, operating costs are around $0.16/mile, or 10% higher, in 2024. Estimated profit margins for small fleets are identical to May 2019. Van spot rates are predicted to reach a peak YoY growth rate in Q4, with contract rates predicted to fall just short of flat YoY by the end of the year. Truckload capacity tightened across major markets in the second week of June as loads moved jumped by 31% WoW nationally. In the top 5 states for volume (California, Texas, Georgia, Illinois and New Jersey) rates were up $0.03/mile on 27% higher volume.
Unfortunately for dry van carriers, the outlook for improved conditions remains bleak throughout 2024. What volumes do move in the for-hire sector are easily absorbed by the excess capacity that continues to contract at an exceptionally slow pace. Apart from holiday and seasonal pressures, the industries that drive dry van carrier capacity are not posed for any significant rebounds. While dry van rates continue to bounce along the floor, expect the floor to increase as the back half of 2024 progresses, resetting higher through periods of seasonal volatility.
Reefer Overview
Spot Rates
Key Points
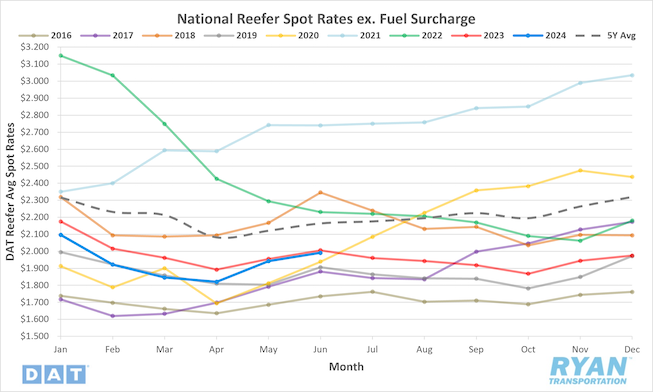
- The national average reefer spot rate excluding fuel increased 2.5% MoM, or roughly $0.05, in June to $1.99.
- Average reefer spot linehaul rates were 0.7% below the average in June 2023 and sit 8.0% below the 5-year average.
- Initially reported average reefer contract rates exclusive of fuel increased 1.2% MoM in June but remained below June 2023 levels by 2.7%.
Load-to-Truck Ratio
Key Points
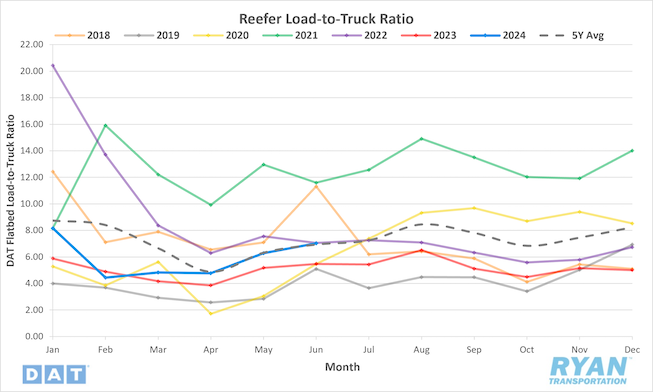
- The reefer LTR increased 11.9% MoM in June to 7.03 and was up 28.3% compared to the same month last year.
Market Conditions
Reefer Summary
Watermelons have surged to dominate the national truckload tonnage in the past 30 days. Production in Florida is 11% higher YoY, accounting for 53% of watermelon shipments in the second week of June. Mexico (34% of volume) is reporting 17% higher volumes YoY, followed by Texas (13% of volume) reporting 19% higher volume YoY. This trend is expected to continue as production increases in Georgia, California, Indiana and North Carolina. Cherry production started earlier this year in Washington state, compared to California’s shorter season, with truckload volumes just half of what they were a year ago. Northwest grown cherries across Washington, Oregon, Idaho, Utah and Montana make up over 70% of the fresh cherries found in stores from mid-June through early September.
The USDA is reporting an adequate supply of trucks this year in Florida at the start of June, with peak linehaul rates for the year happening in late May to early June. Florida accounted for 22% of the second week of June’s reefer volume, compared to 14% at the end of May, and truckload capacity was tight for loads of tomatoes in the third week of June. According to the USDA, this was the only region needing to report an adequate supply of trucks, so Florida is having a great harvest season. Conversely, during the second week of June, all 17 USDA growing regions reported an adequate supply of reefer equipment as national produce volume was down 4% YoY.
Flatbed Overview
Spot Rates
Key Points
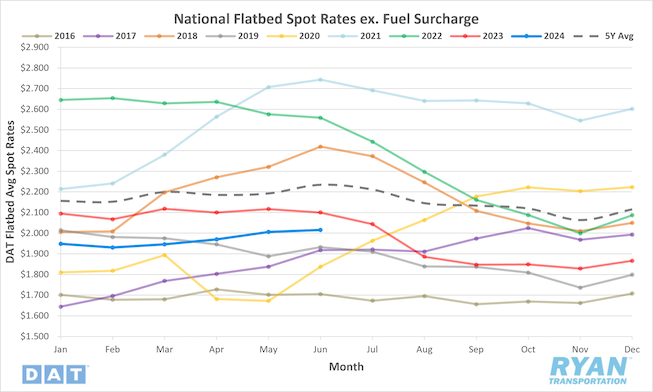
- The national average flatbed spot rate, excluding fuel, increased slightly in June by 0.5% MoM, or $0.01, to $2.02.
- Compared to the same month last year, average flatbed spot linehaul rates were down 4.0% on an annual basis and sit 9.8% below the 5-year average.
- Initially reported average flatbed contract rates exclusive of fuel fell 1.1% MoM and sit 4.2% below June 2023 levels.
Load-to-Truck Ratio
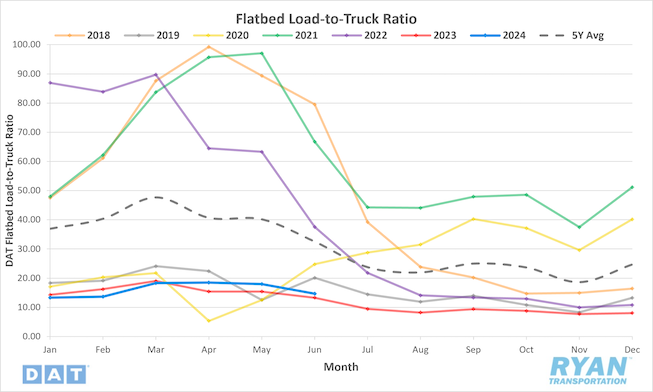
Key Points
- The flatbed LTR registered 14.65 in June, a decrease of 18.5% from May’s levels, but is 10.2% higher than June 2023.
Market Conditions
Flatbed Summary
Flatbed carriers looking for demand signals of an improving truckload market are in for a waiting game, as the U.S. Census Bureau’s April report showed single-family home construction was mostly flat. It is, however, 22% higher than last year, but now home builders are waiting as the Federal Reserve has indicated rate cuts may not occur this year. Since the residential construction boom peak in May 2022, spending has decreased by 8%. Associated Builders and Contractors (ABC) reported that its Construction Backlog Indicator fell to 8.3 months in May. The ABC monthly Construction Backlog Indicator is a forward-looking national economic indicator that reflects the amount of work already under contract but has yet to be performed by contractors. It is the only leading indicator that offers such an acute specificity regarding the future activity level among construction firms for flatbed carriers.
Overall construction spending has grown over the past three years, driven by a wave of companies building manufacturing plants, warehouses and data centers. Since the commercial building inflection point in October 2021, the amount spent has increased by 40%. Office construction has taken a sharp downturn, though, reflecting the challenges posed by the uncertain return of American workers to the office environment. To go along with commercial construction, the Fort McHenry Federal Channel has been restored by the U.S. Army Corps of Engineers and U.S. Navy Supervisor of Salvage Diving. The channel is now allowing commercial maritime traffic through the Port of Baltimore, but after removing around 50,000 tons of wreckage and reopening the port, outbound flatbed volumes have not fully recovered and are currently 35% lower than last year.
Another issue impacting flatbed volumes in June came from U.S. energy firms cutting the number of active oil and gas rigs in operation. The oil and gas rig count, an early indicator of flatbed demand, dropped 15% below the same time last year. The Houston freight market, a large supplier of drill pipe, casing, and field equipment to the West Texas Permian Basin, reported a 17% lower volume of loads from Houston to Lubbock compared to last year.
Intermodal
Spot Rates
Key Points
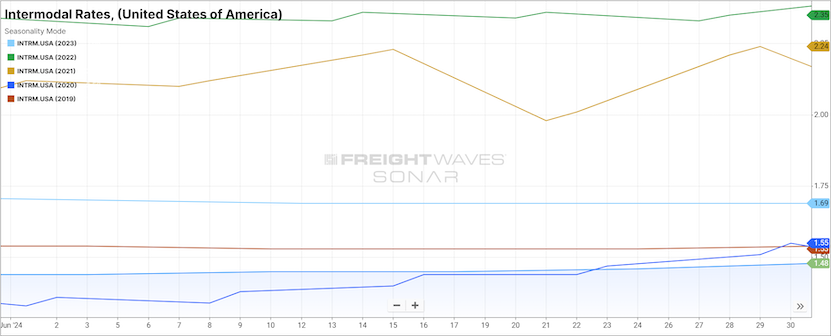
- The FreightWaves SONAR Intermodal Rates Index (INTRM.USA), which measures the average weekly all-in door-to-door intermodal spot rate for 53’ dry vans across a majority of origin-destination pairings, increased in June, rising 2.8% MoM, or $0.04, to $1.47.
- Compared to June 2023, intermodal spot rates are down 12.5% YoY and sit 21.4% below the 5-year average.
Volumes
Key Points
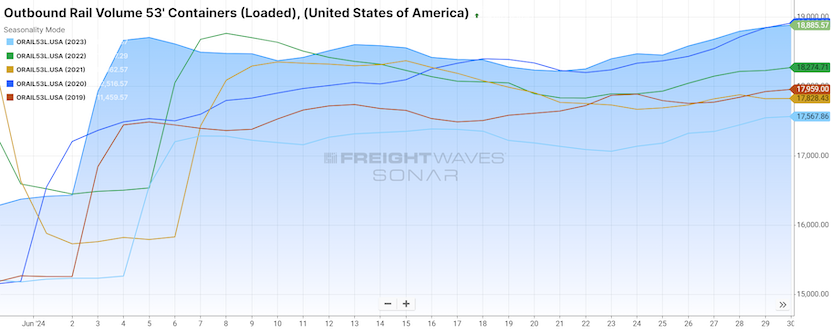
- Total loaded volumes for 53’ containers for all domestic markets, measured by the FreightWaves SONAR Loaded Outbound Rail Volume Index (ORAIL53L.USA), were up 15.3% MoM at the end of June compared to May.
- Compared to the same time last year, total loaded volumes for 53’ containers were 7.5% higher YoY and were 4.3% higher than the 5-year average.
Intermodal Summary
In June, forecasts for rail conditions showed continued improvement with overall volumes and rates experiencing gains, according to the latest report from the Association of American Railroads (AAR). Intermodal traffic saw a significant year-over-year increase of 8.7%, equivalent to approximately 85,900 units, while carload volumes declined by 1.7%, totaling about 15,000 units less compared to the previous year. This combined to a 3.8% year-over-year growth in overall rail volumes for June. Carload traffic remains below 2023 levels, primarily due to reduced coal shipments, which decreased by 10.4% year-over-year, but other sectors such as chemicals, motor vehicles and intermodal shipments have shown growth. Excluding coal, carload traffic actually increased by 1.7% compared to June 2023.
Despite the uptick in volumes, rail rates continue to face challenges in stabilizing as they contend with competitive pressures from weak over-the-road rates, which remains the industry's predominant challenge. Initial reports indicate that intermodal contract rates in June slightly surpassed those of June 2023, suggesting a possible stabilization of contract rates. However, given the ongoing struggles in the truckload market, the timeline for a definitive rate rebound remains uncertain. The FreightWaves SONAR Intermodal Contract Savings Index (IMCSI1.USA), reflecting the percentage difference between initially reported dry van contract rates excluding fuel and initially reported intermodal contract rates excluding fuel, hit a new low in early June at 6.31%.
Further Reading
ATA Reports Tonnage Turnaround for May With 1.5% Rise | Transport Topics
Preliminary June Class 8 net orders see sequential and annual declines | Logistics Management
Teamsters Canada Rail Conference members reauthorize strikes against CN, CPKC | FreightWaves: Modern Shipper