
Executive Summary
After months of mixed signals, February’s data provided a sense of stability across the transportation sector. Demand levels outperformed traditional Q1 softness while excess capacity continues to exit the market. While transportation numbers were solid, the same cannot be said for the broader economy as monthly data for January, and early indicators for February, have mostly tilted negative.
At the surface, labor market data, which has been a bedrock for the health of the economy over the years, appeared to reflect strong growth in February with the addition of 275K jobs to nonfarm payroll. Taking a deeper look reveals much of that growth came from sharp downward revisions to both December and January estimates totaling 167K, leaving a net increase of just 108K. Meanwhile, initial Q4 real GDP growth estimates of 3.3% were adjusted down slightly to 3.2%, as strong downward revisions to private inventory investments were partially offset by upward revisions in government and consumer spending. Finally, inflation levels appear to be accelerating again as core PCE increased in January, though was outpaced by the rise in consumer income. However, preliminary data from February indicates further increases in inflation are expected, raising concerns of the Fed’s timeline for projected rate cuts in 2024.
Within the transportation industry, consistent truckload volumes above previous years’ levels in February imply a market recovery is underway. The only threat to a real return towards growth remains in the form of lingering excess capacity, which continues to add negative pressure on rates. The intermodal outlook continued to improve in February with both volumes and rates registering gains. The sustainability of improving rail conditions, however, remains a byproduct of the continued competitive landscape with the weak truckload market.
In the maritime sector, February saw U.S. container import volumes drop 6% MoM from January to 2,137,724 twenty-foot equivalents (TEUs) but registered 23.3% above February 2023 levels. According to Descartes’ Global Shipping Report in March, the annual gains do not account for the impact of the Chinese Lunar New Year in 2023 and the non-impact in 2024 based on when the holiday occurred. Removing the holiday distortion, YoY increases registered closer to 13% and were up 19.5% from pre-pandemic February 2019. Despite ongoing attacks in the Red Sea and unchanged conditions in the Panama Canal, transit times were less affected in February. The continued diversion of ships around the Suez Canal and the increase in East Coast/Gulf Coast port activity actually translated to lower transit times in February.
Industry Overview
February Key Figures (YoY)
| Truck Data Points | YoY Change (%) |
|---|---|
| DAT Spot Rates (incl. FSC) | -8.0% q |
| Fuel Prices | -8.4% q |
| ACT Class 8 Preliminary Orders | 16.0% p |
| ATA NSA Truck Tonnage* | -2.8% q |
| Cass Freight Index | -5.5% q |
| Cass Freight Expenditures | -19.8% q |
| Cass Freight Shipments | -4.5% q |
*Report released on 2/20/2024
Main Takeaways
Economy
Although manufacturing activity in the U.S. continued to contract in February, analysts expect a potential near-term rebound, supported by positive economic trends, improved demand signals and growth in crucial sectors. [READ MORE]
Truckload Rates
Spot rates took a sharp dive in February, erasing January’s gains and raising concerns for smaller carriers while contract rates were virtually flat. [READ MORE]
Truckload Demand
Volumes were remarkably consistent in February signaling optimism towards continued growth through the rest of the year. [READ MORE]
Truckload Supply
Truckload markets struggled despite initial signs of recovery in January, as declining rejection rates throughout February indicate continued excess capacity. [READ MORE]
Truckload Capacity Outlook
New truck orders remained strong in February despite the carrier population continuing to decline. [READ MORE]
Fuel
Average fuel prices increased after four months of declines amidst global supply concerns. [READ MORE]
OTR By Mode
Dry Van:
Dry van shipments are showing positive signs in 2024 with growth, particularly on the West Coast and in alternative ports like Houston and Ft. Worth, but overall market stability requires adjustments in carrier capacity. [READ MORE]
Reefer:
Despite February's decline due to unseasonably warm weather, the reefer market is expected to rebound with the upcoming peak produce season. [READ MORE]
Flatbed:
The growth in solar energy, port specialization, manufacturing investments, and construction projects create both opportunities (increased freight) and challenges (managing demand fluctuations) for flatbed carriers in 2024. [READ MORE]
Intermodal:
Intermodal transportation in 2024 is experiencing a rebound with volume growth, despite winter storm disruptions and ongoing pricing pressure from the truckload market. [READ MORE]
Economy
United States ISM Manufacturing PMI
Key Points
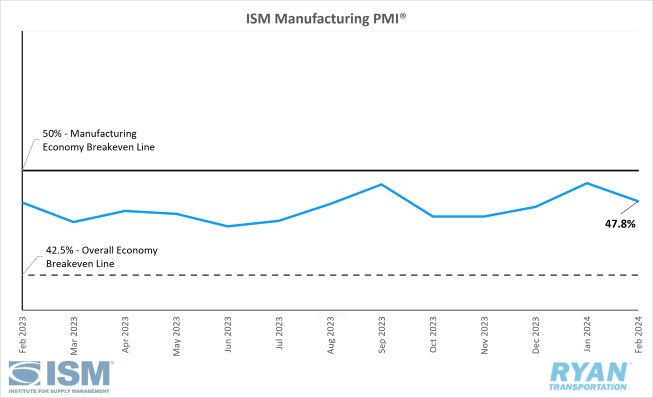
- The Institute for Supply Management’s (ISM) Manufacturing PMI® registered 47.8% in February, a 1.3% decrease from January’s reading of 49.1%, and remained in contraction territory.
- The New Orders Index returned to contraction territory in February, falling 3.3% from January’s figure of 52.5% to 49.2%.
- The Production Index also moved back into contraction territory, registering 48.4% in February, a 2.0% drop from its January reading of 50.4%.
- The Employment Index registered 1.2% lower in February than January, dropping from 47.1% to 45.9%.
- The Customers Inventories’ Index was up 2.1% in February to 45.8% but remains in “too low” territory.
Summary
Manufacturing activity in the U.S. contracted for the 16th consecutive month in February and at a faster rate compared to January. In terms of the overall economy, February marked 46 straight months of expansion after one month of contraction in April 2020. According to the ISM, a Manufacturing PMI® reading above 42.5%, over a period of time, generally indicates an expansion in the overall economy. That guidance has been revised down from 48.7%. Data from February’s PMI® report suggests demand is slowing with outputs easing and inputs remaining accommodative. Per ISM’s reporting, the past relationship between the Manufacturing PMI® and the overall economy indicates that February’s reading of 47.8% corresponds to a 1.5% positive impact on real gross domestic product (GDP) on an annualized basis.
The demand components of the diffusion index, measured by the New Orders, Customers’ Inventories and Backlog of Orders indices, were moderated last month. Seasonal headwinds, which had a rather significant impact on new orders, were too strong to overcome, pulling the subindex back into contraction territory after a month of growth. According to the ISM report, 24.4% of survey panelists reported increases in new orders compared to the 17.4% reporting decreases (down from 23.5% in January). While these results would not typically reflect an index reading in contraction, the 4.3% seasonal adjustment moved the index below the 50% breakeven line. Meanwhile, the Backlog of Orders index contracted at a slower rate in February, increasing 1.6% over January but contracting for a 17th consecutive month. Customers’ Inventories also decreased at a slower rate but remained in “too low” territory in February compared to January, following a 2.1% increase in the subindex’s reading.
The Production and Employment indices, used to measure output in the diffusion index, combined for a 3.2% downward impact on the Manufacturing PMI® calculation in February. Per the ISM, panelist companies continue to effectively manage production levels MoM but, similarly to new orders, seasonal adjustments outpaced any growth. February’s readings of the Employment Index indicated head-count reductions continued most notably through layoff activity.
Why it Matters:
The latest Manufacturing PMI® reading came in below the consensus of 49.5% and was an unexpected setback to those hopeful for a return to growth in the near term for the manufacturing industry. Despite higher borrowing costs, cooling demand for goods and curtailing business investments in equipment, the overall economy has continued to grow while suppliers still have the capacity to accommodate further expansion. These factors have led Timothy Fiore, chair of the ISM Manufacturing Business Survey Committee, to remain bullish on the manufacturing activity outlook, indicating the sector is ready to begin a growth cycle. Fiore is predicting the Manufacturing PMI® to register above the 50% breakeven threshold as early as March or April this year.
The data incorporated into February’s reading indicated the weakness observed in the Manufacturing PMI® primarily resulted from seasonal factors outpacing actual performance. The ISM elaborates on the use of seasonal factors that contribute to the Manufacturing PMI® calculation, stating they “allow for the effects of repetitive intra-year variations such as weather conditions and institutional arrangements as well as difference attributable to non-moveable holidays.” The report’s summary pointed towards leap day in February as the primary seasonal factor, noting the extra day provided a not-insignificant 5% increase in working hours compared to a 28-day month.
The case for a bullish near-term outlook for the manufacturing sector stems from improvements in MoM comparisons of survey respondent’s results. The most notable comparison, according to the ISM, comes from the share of manufacturing GDP with a composite PMI® at or below 45%, which is a good barometer of overall weakness within the sector. In February, that figure was 1% which is down from 27% in January and 48% in December. Another notable comparison comes from panelists’ comments citing soft demand. Roughly 17% of February’s responses fell into this category, down from 34% reported just a few months earlier in November.
Of the six biggest manufacturing industries; Chemical Products; Transportation Equipment; Food, Beverage & Tobacco Products; Computer & Electronic Products; Machinery; and Fabricated Metal Products; three (Fabricated Metal Products, Chemical Products and Transportation Equipment) registered growth in February. This provides further support towards a rebound in manufacturing as the first two are “foundational” industries, meaning they provide products and components across the sector.
Macro Economy
- Nonfarm payroll employment rose by 275,000 jobs in February, exceeding the 190,000 consensus and surpassing January’s revised figure of 229,000 from 353,000 on a seasonally adjusted basis, according to the most recent jobs report released by the Bureau of Labor Statistics (BLS).
- The unemployment rate increased 0.2% in February to 3.9% from 3.7% recorded in January.
- Total Transportation and Warehousing employment rose by 19,700 jobs.
- Truck Transportation remained virtually unchanged, dropping by 300 jobs.
- Warehousing and Storage employment decreased by 4,000 jobs.
- Both the headline and core Personal Consumption Expenditures (PCE) Prices Index, the Fed’s preferred gauge for measuring inflation, increased MoM in January by 0.3% and 0.4%, respectively, on a seasonally adjusted basis, according to the most recent report from the Bureau of Economic Analysis (BEA).
- On an annual basis, headline PCE rose 2.4% in January seasonally adjusted and was 0.2% lower than December.
- Core PCE, which excludes food and energy, rose 2.8% on a 12-month basis seasonally adjusted, 0.1% lower than December’s reading.
- The all-items Consumer Price Index (CPI) increased 0.4% MoM in February on a seasonally adjusted basis, after rising 0.3% in January, according to the February CPI report released by the BLS.
- The all-items index less food and energy increased 0.4% MoM in February on a seasonally adjusted basis, unchanged from January.
- Headline CPI rose 3.2% on an annual basis, slightly higher than the 3.1% increase registered in January.
- Core CPI rose 3.8% over the last 12 months, increasing 0.4% from January’s reading of 3.4%.
Truckload Rates
Spot Rates
Key Points
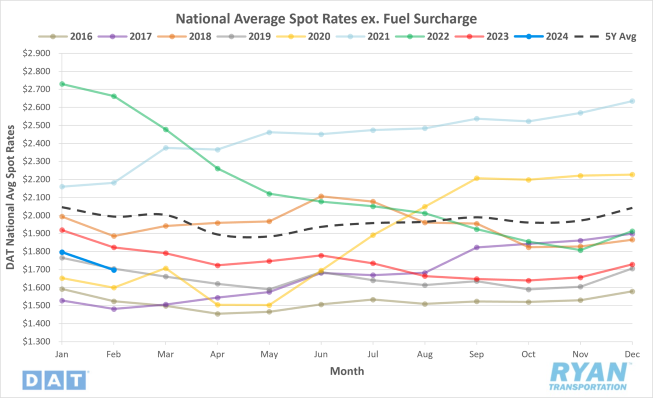
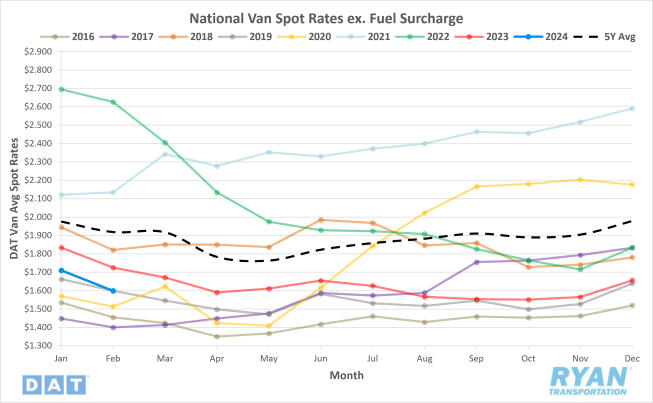
- The national average spot rate excluding fuel declined by 5.6% MoM, or $0.10, in February after three months of consecutive gains.
- The average spot linehaul rate in February was down 6.9% compared to a year ago and sits 14.9% below the 5-year average.
Contract Rates
Key Points
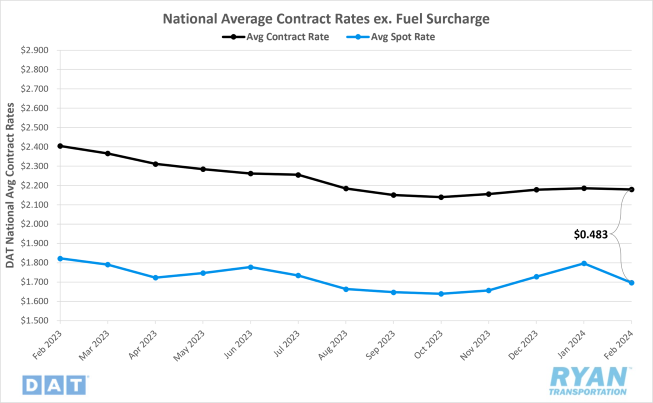
- Initially reported average contract rates not inclusive of fuel fell slightly in February, dropping 0.3% MoM, or $0.006.
- On an annual basis, average contract linehaul rates are down 9.6% YoY, or $0.225, in February.
- The contract-to-spot spread surged nearly $0.10 last month, increasing from $0.389 in January to $0.483 in February.
Summary
The three-month streak of consecutive MoM gains came to an end in February as the average spot rate excluding fuel turned negative and underperformed typical seasonality. The unseasonable gains observed in January were wiped out in February as average spot rates sustained noticeable, sequential declines throughout the month. February’s $0.10 MoM drop in average spot linehaul rates outpaced the pre-pandemic average decline between January and February of $0.068. It was also the most significant drop between the two months since 2018, when rates registered $0.106 lower in February.
Following a cold snap in mid-January that kept spot rates elevated near their holiday highs, the DAT 7-day average spot rate excluding fuel registered a $0.048 WoW decline in the first week of February. The 2.6% drop to open the month was the largest WoW decline since the third week of January in 2023. Spot linehaul rates recorded by DAT 7-day moving average index continued their steady decline through the second and third week, falling a total of $0.121 before essentially flattening out in the final week. By the last week of the month, the DAT 7-day average spot rate was down 6.9% from the last week of January and was 8.5% below the same week last year.
On the contract side, initially reported linehaul rates also registered their first decline, albeit barely, in February after three months of sequential increases. Average contract rates excluding fuel have been virtually flat MoM since the start of Q4 last year as the degree of change has averaged just 0.3% and remained below 1% each month. The stability in contract rates, despite persistent negative pressure from depressed spot market rates, has continued to keep the contract-to-spot rate spread above the pre-pandemic average range of $0.35-$0.45. After surges in spot rates in December and January pulled the spread back within the higher end of that range, the deterioration of market conditions in February returned it to its elevated status at $0.483. Despite the contract-to-spot spread continuing to indicate an imbalance between supply and demand exists, there are promising signs that the market is in the early stages of recovery. Throughout 2023, the contract-to-spot spread averaged $0.08 higher than 2022. However, through the first two months of 2024, that average has dropped to $0.11 below the same time last year.
Why It Matters:
Declining spot rates in February are not out of the ordinary in terms of typical seasonality expectations. However, the further decline and degree of those declines to already historically low rates in February likely made it difficult for smaller carriers with increased exposure to the spot market.
The outbreak of winter storms in January that impacted most of the contiguous United States exacerbated the spot market’s weak performance in February. By delaying capacity from returning to the road following the holiday break, the unfavorable weather conditions propped up the elevated holiday rates deeper into the new year. In turn, this extension of higher rates narrowed the timeline for the market to adjust to an influx of capacity amidst unchanged demand. Rather than gradual decreases setting in after the second week of the year, the spot market made a sharp correction, cutting rates quickly and significantly.
The volatility in spot rates over the last few months has done little to influence any discernible change within the contract market. The consistency of the contract market since the start of Q4 is not coincidental, as it tied in closely with the 2024 bid cycle that recently came to an end in February. It has been noted by several national trucking companies that the most recent bid season has been one of the more competitive cycles based on the current market dynamics. Despite the capacity disruptions observed in January, shippers are still very much in control of pricing power. With routing guide implementation and new contracts typically going into effect during the second quarter, the impact of that pricing power on carriers has yet to be revealed. One thing for certain, though, is that based on the elevated spread, there is still room for contract rates to come down, or for spot rates to come up, before a true market rebalance can take place.
Truckload Demand
Key Points
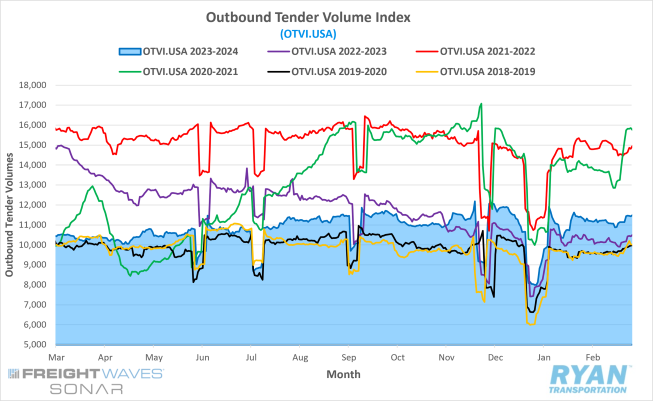
- The FreightWaves SONAR Outbound Tender Volume Index (OTVI.USA), a measure of contracted tender volumes across all modes, ended February 1.13% above the levels recorded 30 days before the end of January.
- The monthly average of daily tender volumes recorded by the index in February was 4.4% higher than January’s average, increasing from 10,715.50 to 11,186.87.
- On an annual basis, February’s average daily tender volumes were up 10% compared to 2023 but were 4.5% below the 5-year average.
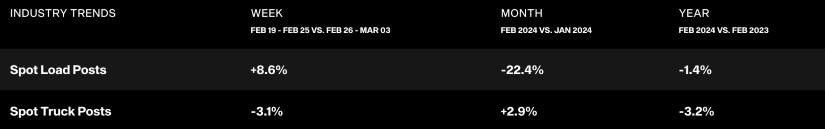
- After spot load posts surged in January, volumes resumed their double digit declines in February, dropping 22.4% MoM but narrowing the YoY gap to just 1.4% below 2023 levels.
- The Cass Freight Index Report, which analyzes the number of freight shipments in North America and the total dollar value spent on those shipments, increased in February on a monthly basis for both shipments and expenditures by 7.3% and 4.0%, respectively, but remain below YoY levels by 4.5% and 19.8%, respectively.
Summary
Unlike the significant swings experienced in the last two months, as a result of holiday and weather disruptions, contract volumes were remarkably consistent throughout February. After a quick recovery at the end of January, demand levels remained virtually unchanged WoW at the start of February before settling back in with typical seasonality patterns and gradually declining. Through the second week and much of the third, the tender volume index fell by just over 3% before leveling out. End of month freight activity in the at the start of the final week saw demand jump by roughly 5% WoW to bring levels back up near where they started the month.
On a quarterly basis, average demand levels in Q1 2024 are shaping up to be relatively robust compared to those observed throughout last year. Compared to Q4 of last year, average daily tender volumes are projected to finish 3.5% higher in Q1 2024 and sit 11% higher than the same quarter last year, when the OTVI recorded its lowest quarterly average since Q2 2020. Quarterly averages registered consecutive growth in both Q2 and Q3 2023 of 3% and 5%, respectively, before the growth stalled in Q4.
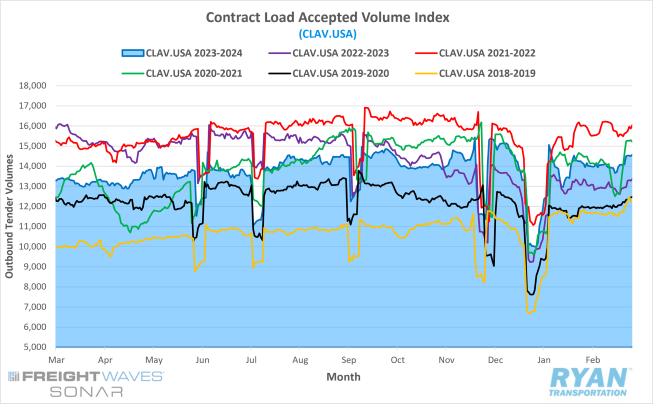
After gaining market share in January, as capacity struggled to return in full to the market, spot market volumes resumed their double digit decline in February as contract freight continues to dominate the marketplace. Despite the MoM decline in spot market activity, the gap in YoY differences have narrowed to their lowest level since the onset of the market downturn. Further support for contract market dominance can be seen in the FreightWaves SONAR Contract Load Accepted Volume Index (CLAV.USA), shown below, which is similar to the OTVI but removes the tenders. According to the index, accepted load volumes at the end of February were up 2.7% MoM from January and registered 9.1% higher than February 2023 levels. The narrowing YoY difference indicates that actual freight flow is recovery from the bottom of the market cycle.
Why It Matters:
The resiliency in demand so far in the first quarter is a positive indicator for the remainder of the year and further reflects a market gradually working towards rebalance. Despite freight volumes trending positive YoY, which is one of the strongest signs of a freight market recovery, truckload conditions continued to deteriorate in February. This supports the theory that an uptick in demand alone will not bring the market back to equilibrium but will require further correction on the supply side, which is discussed further below.
As the market works towards rebalance, preliminary data from February provides promising indicators on the demand side in the months ahead. The first major impact on future demand levels in the near term stems from the increase in import bookings and volumes in January and February. On the East Coast, both the Ports of New York and New Jersey reported January 2024 was the third-busiest start of the year on record, falling short of the pandemic-fueled boom in 2021 and 2022. On the West Coast, import bookings from China to the U.S. set record highs during the first two weeks of February ahead of the Lunar New Year. With bookings generally averaging 42 days ahead of when shipments reach the U.S. ports, this implies and significant jump in volumes along the West Coast ports in late March and April.
Another favorable trend for carriers in light of the strong demand levels for Q1 is the continued adoption of the just-in-time (JIT) inventory strategy by many shippers. The success of the JIT inventory strategy relies on the stability of customer demand and inputs further up the supply chain, as well as the availability of widespread capacity. A failure by any of these components to live up to shipper expectations will cause freight markets to tighten and see the contract market lose volume share to the deflated spot market.
Truckload Supply
Key Points
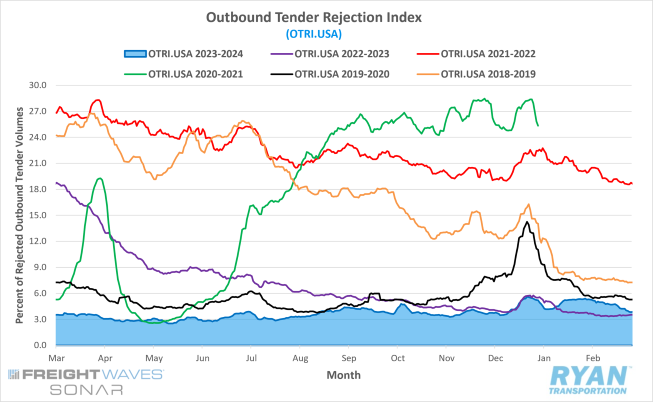
- The FreightWaves SONAR Outbound Tender Rejection Index (OTRI.USA), a measure of relative capacity based on carriers’ willingness to accept freight volumes under contract reflected as a percentage, ended February at 3.84%, a 1.51% drop from 30 days prior towards the end of January.
- Average daily tender rejections in February registered 4.73% by the index, a 0.15% drop from January’s average of 4.88%.
- Compared to the same month in 2023, average daily tender rejections in February were 1.25% higher and sit 7.31% below the 5-year average.
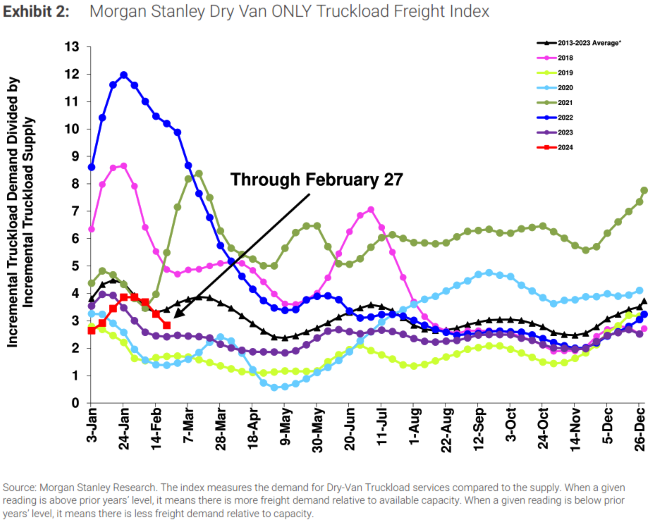
- The Morgan Stanley Truckload Freight Index (MSTLFI) continued to outperform seasonality early in February, moving above long-term averages briefly before sequential declines and underperformance of seasonality dropped the index back below long-term averages for the rest of the month.
Summary
Despite stability in demand levels throughout February, rejection rates were unable to maintain the positive momentum they incurred in the back half of January. After remaining above 5% through the first week, tender rejections registered steady declines through the rest of February, dropping a total of 1.55% and falling back below 4% in the final three days of the month. The late February decline to sub-4% levels was the first time the index had registered below that mark this year, with the reading on the final day of the month of 3.84% being the index’s lowest since early December. Despite the steady declines, however, average daily tender rejections were only down 18 basis points (bps) from January, which outperformed the seasonal average of just over 1% for this time of year.
On an annual basis, tender rejections on the last day of February (excluding leap day) were 37 bps higher than the same time last year while average daily rejections were up 1.25% YoY. February marked the second consecutive month of YoY increases in average rejection rates, which had not seen since June/July 2021. Although the annual increases are a positive indicator that excess capacity is leaving the market, February’s average of daily OTRI values still remains roughly 2% below the pre-pandemic average for the month. This suggests that further correction is needed in the supply-side imbalance.
The Morgan Stanley Truckload Freight Index echoes a similar sentiment, as February’s readings registered sequential declines and fell back below the long-term averages. According to the index, a reading higher than the prior year’s level means there is more demand relative to available supply. After moving above the previous years’ levels towards the end of January, the declines recorded by the MSTLFI in February have narrowed that gap, though still remain elevated compared to 2023.
Why It Matters:
The surge in rejection rates in January provided some hopeful signs that excess capacity was finally leaving the marketplace but was quickly shut down following the performance of the OTRI in February. Though the declines in February were incremental, the direction of the trend is what is key for instilling any future optimism. Since rejection rates that range between 5-7% are enough to create disruptions across major carrier networks, OTRI values that track above that 7% mark or experience rapid gains in a short period of time generally translates to upward pressure in spot market rates. Meanwhile, as we have now seen over the last 17 months, OTRI readings below that 5% threshold becomes a deflationary force on spot rates.
It has become increasingly apparent over the last few months that the current market recovery will likely not be one that occurs in a short time frame, but rather a gradual rebalancing of market forces. As evident from earlier, demand levels are continually showing signs of improvement as inventory destocking plays out and goods consumption is on the rise. While the industry has certainly shed some of its excess supply over the last few months, the data from February still clearly suggests that the oversaturation of carriers in the market is hampering improvement in conditions for truckload carriers.
Truckload Capacity Outlook
Key Points
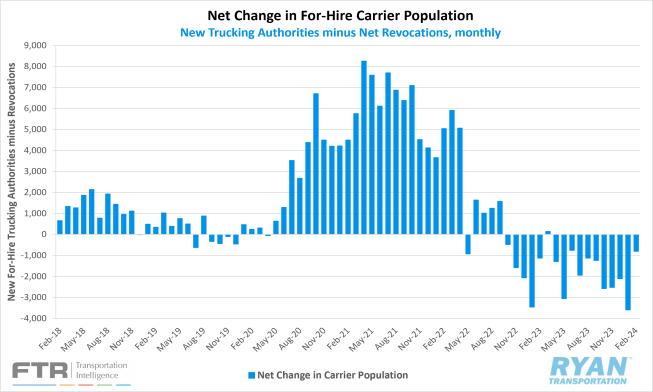
- Total net revocations, a measure of total authority revocations minus the number of reinstatements, fell significantly in February by 2,335 carriers, dropping from 7,631 carriers in January to 5,296 carriers in February, according to FTR’s preliminary analysis of the Federal Motor Carrier Safety Administration’s (FMCSA) data.
- Meanwhile, the number of newly authorized for-hire trucking companies registered their second MoM increase in February, with the FMCSA authorizing 4,497 new carriers compared to the 4,036 new authorities registered in January.
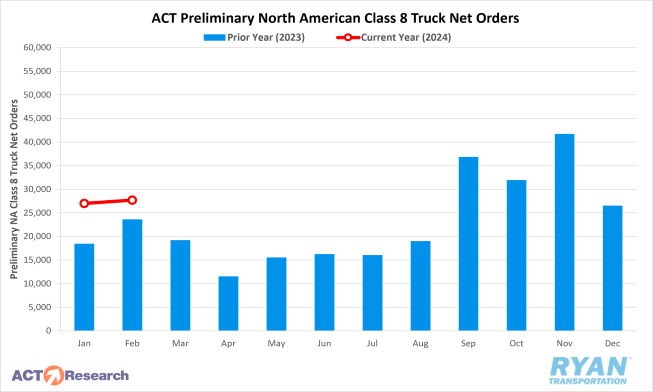
- Depending on the source, preliminary North American Class 8 Order estimates in February ranged from 25,700 units per FTR’s reporting and 27,700 units according to ACT Research’s analysis, with both estimates reflecting annual gains of 11% and 17.4%, respectively.
Summary
After recording the largest single-month drop ever in January of 3,595 carriers, the net change in the for-hire trucking population decreased by just 799 carriers in February, the smallest drop in the carrier base since June. The significant difference in the net change MoM was primarily driven by a substantial drop in net revocations, as February’s figure of 5,296 total authorities revoked was 2,335 carriers shy of January’s figure of 7,631. According to FTR’s preliminary analysis of FMCSA data, net revocations in February were the lowest they have been since April 2022.
Meanwhile, the number of new carriers entering the market increased in February to 4,497 carriers, 461 more than the number recorded in January. The uptick in new authorities in February marked the highest level of new carriers entering the market since October of last year. According to the FMCSA data, smaller fleets operating with just one or two trucks continue to make up the majority of new entrants and revocations each month.
The historically high revocation figures and overall weak truckload market have yet to have any negative impact on new truck orders as Class 8 orders remained reasonably strong in February. Per FTR’s reporting, initial expectations of the rapid easing in demand in 2024 have yet to come into fruition but that order activity is not significantly higher than replacement demand levels. According to FTR, February’s figure brings the annualized figure to 263,700 units. According to ACT Research, February has the fourth largest seasonal factor of the year of 8%, which brings the seasonal adjusted number down to 25,600 units and a 5% increase over January. While ACT states that the underlying details for February’s order volumes has yet to be collected, demand levels continuing at high levels indicates that U.S. consumers continue to be strong market participants.
Why It Matters:
Though the market continues to shed excess capacity, the slower rate of carriers exiting the market in February is interesting given the timing. Revocation data can be volatile month to month and it can be difficult to pinpoint exact reasons or circumstances that are responsible for that volatility. In some cases, there are a variety of factors at play that lead to higher carrier entries or exits in a given month. In other cases, it can just simply be a product of the calendar and the FMCSA monthly workflow. For example, as we mentioned in our last update, the FMCSA generally processes the bulk of revocations on Mondays, of which January had five. Though it’s likely not solely responsible, it definitely played a crucial role in January’s record-setting figures.
Another issue that muddies the FMCSA revocation data water is the lag that exists between when a carrier ceases operations and when the revocation is fully processed. According to FTR, it generally takes 30 days to process a revocation, so in practice, a revocation probably occurs 60 or more days from the time a carrier ceases to operate. Based off that assumption, any reaction to the market conditions in December likely would not show up in the data until February. The same dynamic also exists for carriers entering the market. Per FTR’s report, this lag implies that the surge in spot rates and improving market conditions in December may have been interpreted as a turn in the market and kept some financially stressed carriers from exiting. Similarly, the weather disruptions in January that caused rates to surge further likely deterred further capacity from leaving as well, which should be reflected in March’s figures.
The other caveat for the ongoing lingering of capacity in the market stems from the continued strength in Class 8 orders in February. According to FTR, order levels remain above historical averages and seasonal trends as fleets continue to be willing to order new equipment. Both ACT and FTR believe the elevated demand levels are unsustainable given the current market conditions, with both expecting orders to drop down to replacement levels by the end of the year.
Fuel Prices
Key Points
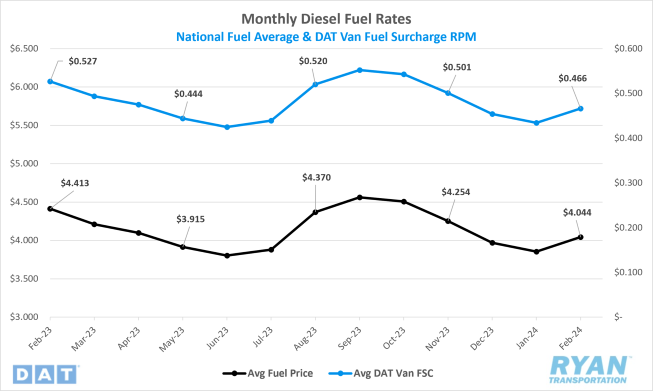
- After four consecutive months of declines, the national average price of diesel rose 4.9% MoM, or $0.19, in February according to the Energy Information Administration (EIA).
- At $4.044, average diesel prices are down 8.9%, or $0.369, compared to levels in February 2023.
- Builds on U.S. crude reserves outpaced draws in February, with the net change in commercial crude inventories increasing by 14.2M barrels (bbls) versus the 11.1M bbls consensus for the weeks ending February 2 and February 23, according to the EIA’s weekly reporting.
Summary
After four consecutive months of declines, average fuel prices turned positive MoM in February and moved back up above $4 per gallon for the first time since November. After moderating in January, the weekly average price of diesel opened February with a $0.032 gain followed by a $0.21 WoW spike in the second week. The surge in the benchmark fuel price during the second week of February was the largest WoW increase since July 31 and the first time since December 4th that the average weekly retail price of diesel had gone above $4. Following the gains in the second week, average fuel prices were flat WoW before ultimately resuming its negative trend in the final week by falling $0.051 WoW.
Meanwhile, U.S. crude reserve builds outpaced draws in February driven by an increase of 12M bbls of commercial crude inventories for the week ending February 9. Much of the surge in inventories during the second week can be attributed to seasonal refinery maintenance as well as production companies keeping utilization rates low after January’s weather events hampered operations. While U.S. inventories have been climbing, global supply levels continue to tighten as OPEC+ announced an extension of its production cuts through June of this year. The recent decision by the oil cartel highlights concerns of softening global demand primarily driven by weak economic indicators from China.
Why It Matters:
The jump in weekly retail diesel prices during the second week of February came as a result of volatility in inventories and production, which caused futures prices for ultra-low sulfur distillate (ULSD) to jump over $0.30. Since retail prices are the end result of movements in futures and wholesale markets, the $0.30 translated into a $0.21 price hike at the pump. In the weeks leading up to February’s second week spike, ULSD production had fallen sharply to its lowest level since the final week of 2022. Much of the drop in production during those weeks stemmed from the cold snap in January that reduced output ahead of refineries being taken offline for seasonal maintenance.
Analysts’ sentiments for the future direction of oil prices remain split between bearish and bullish with both sides providing sound arguments. On the bearish side, the continued extension of production cuts by OPEC+ suggests global demand will likely remain weak through the second quarter of this year. On top of weak demand, initial concerns of the Red Sea/Suez Canal conflict have been quieted as it has had minimal impact on global supply levels. Furthermore, the reduction of supply from Saudi Arabia and the other OPEC+ member nations has largely been offset by rising production levels by countries outside of the group. According to the EIA, the U.S. led global crude oil production in 2023 and set a new record at 12.9M bbls per day.
On the other side of the debate, bullish analysts argue the already historically low inventory levels paired with supply cuts will not be sustainable for the project growth in demand by multiple outlets through the end of 2024. While China’s current economic conditions have underperformed expectations, the country is still projected to account for more than a third of the expected demand growth. Analysts also point to the tensions in the Middle East as a catalyst for higher prices as diversions from the normal route through the Suez Canal has increased dwell time and keeps oil supplies on the water for longer. According to a February Bloomberg article, the longer transit times increases the demand for tankers and there is little supply of those coming to the market this year. The article notes that just two new supertankers are due to come onboard in 2024, which is the fewest additions in nearly four decades and 90% below the yearly average for this millennium.
Dry Van Overview
Dry Van Spot Rates
Key Points
- The national average dry van spot rate excluding fuel declined for the first time in three months in February, dropping 6.5% MoM, or $0.112, to just under $1.60.
- Compared to the same month in 2023, dry van spot linehaul rates in February were 7.3% lower and registered 16.7% below the 5-year average.
- Average dry van contract rates exclusive of fuel were also down just slightly, falling 0.6% MoM to $2.034 and sitting 11.5% below February 2023 levels.
Dry Van Load-to-Truck Ratio
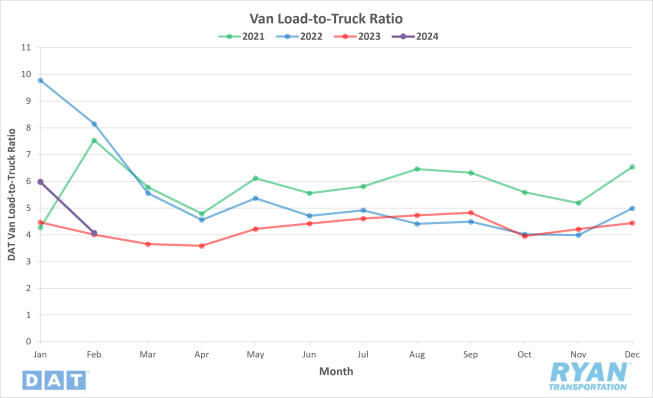
Key Points
- The dry van load-to-truck ratio (LTR) declined 31.9% MoM in February to 4.07 but sits 1.5% higher than February 2023 levels.
Dry Van Market Conditions
Dry Van Summary
Dry van volumes show promise for 2024. January import data reveals a 5% increase year-over-year, the fastest growth in seven years. The West Coast experienced a surge, with TEU volume up 18.2% YoY compared to the East Coast's modest 1.2% rise. This shift reflects efforts to mitigate supply chain disruptions. Notably, the Port of Los Angeles saw a substantial 23% MoM increase in January compared to New York's 2.1%.
Increased Gulf Coast imports are also having an impact on markets. Ft. Worth, Texas witnessed a 23% rise in inbound spot volumes since 2019, with Houston experiencing a similar December surge. This trend reflects cargo diversion away from congested West Coast ports. Ft. Worth is becoming a more balanced market, with outbound volumes exceeding inbound. Elizabeth, N.J. remains crucial despite potential East Coast port labor issues due to its proximity to major highways and the PANYNJ.
Experts suggest freight volumes may have reached a low point, but a significant increase in ton-miles is yet to be observed. The TTMI revenue index shows a rise in Q4 2023, but tempered growth expectations prevail. A 2-4% shift in the demand-to-capacity ratio is needed for a new bull market cycle. While stabilization is evident, significant adjustments in carrier capacity are necessary for the market to improve.
Key dry van markets observed mixed trends. Rates decreased in New Jersey and Los Angeles despite volume increases. Atlanta experienced a slight rate increase with consistent volumes. Ample truckload capacity led to declining linehaul rates in Savannah, despite a surge in imports. Chicago saw volume growth offset by a decrease in rates due to oversupply. Understanding these dynamics is crucial for carriers to optimize their strategies.
Reefer Overview
Reefer Spot Rates
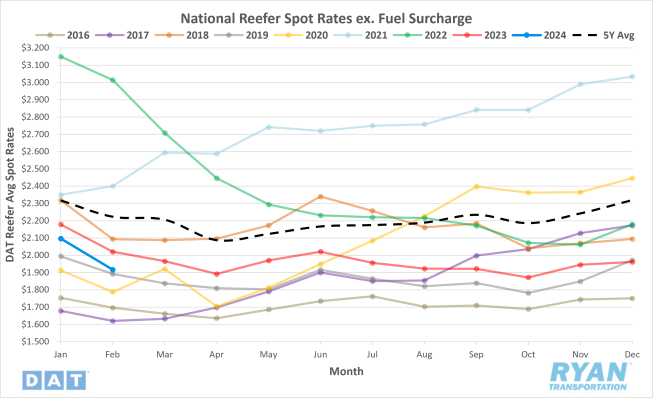
Key Points
- National average reefer spot rates excluding fuel fell 8.5% MoM, or $0.179, in February to just under $1.92.
- Average reefer spot linehaul rates were down 5.1% compared to the same month last year and registered 13.8% below the 5-year average.
- Average reefer contract rates excluding a fuel surcharge decreased slightly in February, dropping 0.6% MoM, and were down 6.4% on an annual basis.
Reefer Load-to-Truck Ratio
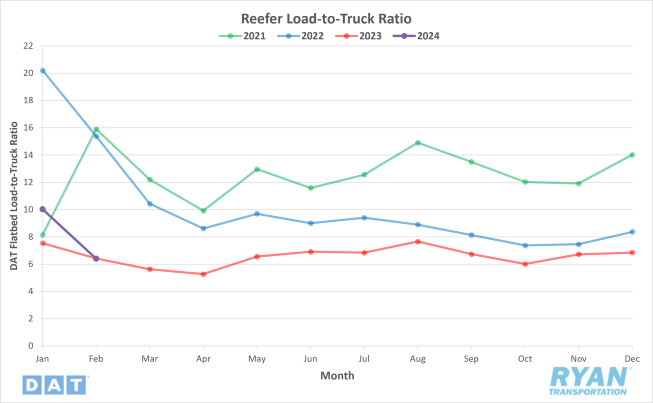
Key Points
- The reefer LTR declined 36.2% MoM in February and sits 0.3% below February 2023 levels.
Market Conditions
Reefer Summary
The MoM adjustments were particularly difficult on the refrigerated sector after the mid-January winter storms caused reefer demand and rates to surge. According to the NOAA, last month ranked as the third warmest February in the 130-year record with average temperatures across the lower 48 states registering 7.2°F above normal for this time of the year. This contributed to the significant declines for the reefer market, as shippers no longer required the use of insulated trailers for temperature-sensitive freight that normally runs via van.
While the declines in February were significant for reefer carriers, they are likely short-lived as the industry approaches peak produce season. Though the last two years has seen minimal impact from produce volumes, that will most likely not be the case in 2024. The ports of Miami have already started to see significant increases in activity from flower imports for Valentines Day and is set to continue over the coming months ahead of Mother’s Day. In the week leading up to Valentine’s Day, floral shipment volumes increased by 78% compared to the previous week, according to the USDA.
Since Miami accounts for over 90% of rose and carnation imports each year, volumes originating from the 305 zip code were up 47% MoM in February while linehaul rates jumped 28%. So far, volumes are on track to surpass last year, though excess capacity has kept spot rates 6% below 2023 levels. Further north in the Sunshine State, the Plant City Strawberry Festival is underway and marks the unofficial start of the U.S. domestic produce season. Peak growing season for strawberries in Florida runs between the end of February through March and is set to further tighten capacity out of the area.
Flatbed Overview
Flatbed Spot Rates
Key Points
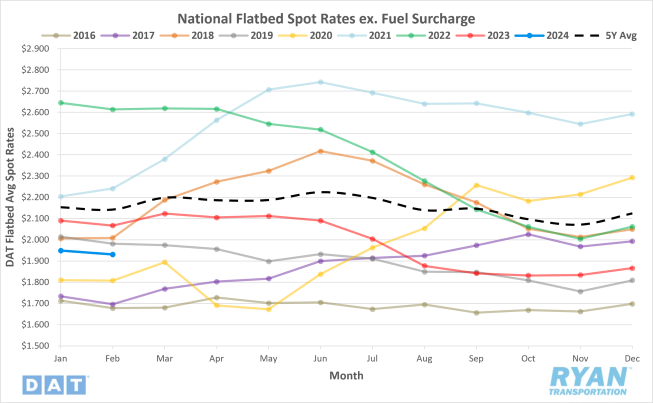
- The national average flatbed spot rate excluding fuel fell by 0.9% MoM, or $0.018, in February to $1.931.
- Average flatbed spot linehaul rates in February were down 6.6% compared to the same month last year and sit 9.9% below the 5-year average.
- Average flatbed contract rates exclusive of a fuel surcharge increased slightly by 0.9% MoM in February but remained 4.3% below February 2023 levels.
Flatbed Load-to-Truck Ratio
Key Points
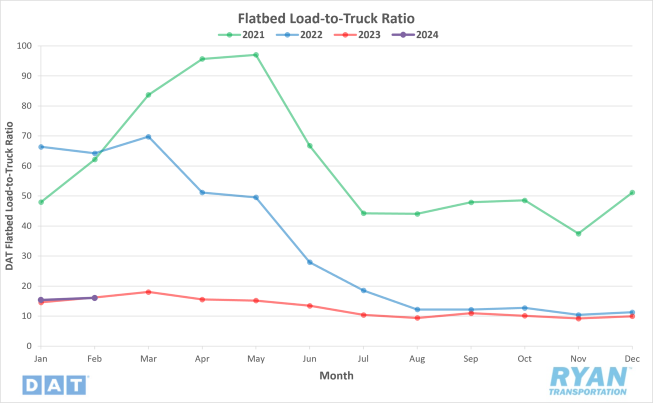
- The flatbed LTR rose 4.3% MoM in February but was 0.7% below the same time last year.
Flatbed Market Conditions
Flatbed Summary
Energy development, port operations, manufacturing investments and construction trends are opportunities and challenges for flatbed carriers as we continue into 2024. Sun-drenched Western states like Nevada are experiencing a boom in solar energy development, leading to a substantial increase in inbound freight for flatbed carriers. The Southwest desert's high solar radiation levels make it an ideal location for solar projects, driving growth in truckload freight volumes. According to Greg Helseth, renewable energy branch chief at the Nevada state office of the Bureau of Land Management (BLM), “There are 96 pending solar plant applications across the state, with 51 in southern Nevada.”
Ports like Baltimore specialize in handling specific types of cargo, such as autos and construction machinery. Baltimore's proximity to major manufacturers in the Midwest contributes to its status as a leading port for farm and construction equipment imports, providing opportunities for carriers and brokers in the machinery transportation market. Baltimore’s import volumes were up 5.3% YoY totaling 1.8m tons, the highest since 2018. This data could be helpful for flatbed carriers and brokers looking to take advantage of the annual peak in machinery imports, typically March/April.
Texas leads in manufacturing and infrastructure investments, including semiconductor plants, electric vehicle and battery plants and clean energy projects. These investments contribute to increased freight demand and opportunities for carriers involved in transporting equipment and materials for construction projects. The construction industry's performance, including housing starts and building permits, serves as a key indicator for flatbed demand. Rising permit rates and builder confidence signal optimism for truckload carriers, particularly in the context of anticipated interest rate cuts and pent-up demand in the housing market. Housing starts and construction projects have direct implications for truckload carriers, with each single-family home start translating to potential flatbed and dry van loads in the spot market. Monitoring housing market trends and construction activity helps carriers anticipate demand and optimize their transportation operations.
Intermodal
Intermodal Spot Rates
Key Points
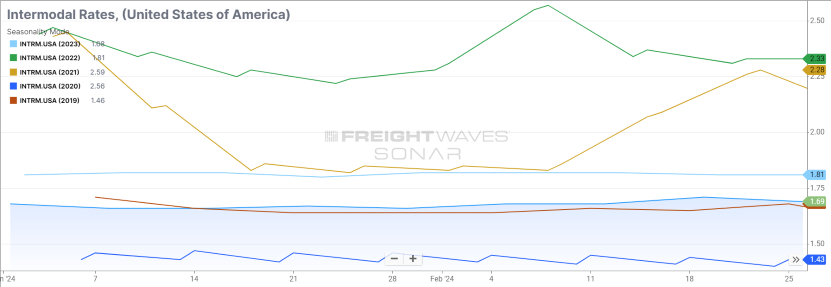
- The FreightWaves SONAR Intermodal Rates Index (INTRM.USA), which measures the average weekly all-in door-to-door intermodal spot rates for 53’ dry vans across a majority of origin-destination pairings, increased by $0.03 MoM to $1.69 in February.
- Compared to February 2023, intermodal spot rates were down 6.6% and were 10.2% below the 5-year average.
Intermodal Volumes
Key Points
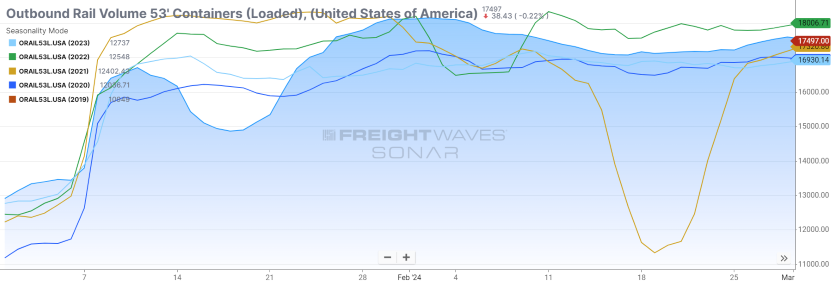
- Total loaded volumes for 53’ containers from all domestic markets, measured by the FreightWaves SONAR Loaded Outbound Rail Volume Index (ORAIL53L.USA), fell 3.2% MoM in February.
- Total loaded volumes in February 2024 were 4.4% higher compared to February 2023 and are 4.3% above the 5-year average.
Intermodal Summary
The intermodal sector so far in 2024 has reversed the negative trends it experienced throughout 2023. Despite the winter storms in January impacting service and temporarily hindering growth during the month, the market has seemingly recovered and is maintaining growth over the previous year’s levels. According to the Association of American Railroads’ (AAR) February report, domestic carload volumes fell 1.3% on an annual basis while total U.S. Intermodal container volume was up 10.9%. With the gains recorded through the first two months of the year, forecasts for intermodal volume through the rest of the year have improved marginally with the outlook now projecting 3.4% growth YoY per FTR.
Both intermodal spot and contract rates also registered gains in February for the first time since October of last year. Initially reported contract rates excluding fuel registered a $0.02 MoM increase but remain 4.9%, or $0.09, below 2023 levels. Though the rate increases are a welcomed sign from rail carriers, there still remains a significant amount of pricing pressure from the weak truckload environment. The FreightWaves SONAR Intermodal Contract Savings Index (IMCSI1.USA), which reflects the average percentage difference between all-in intermodal contract rates and all-in truckload rates in the same lane, registered steady increases in February to end the month at 8.03%. This is an indication that intermodal pricing is attempting to become more competitive with truckload. While the increases are a trend in the right direction, savings via the rail are still well below their long-term averages.
Further Reading
- Carriers’ pricing power slipping amid continued Red Sea conflict – FreightWaves: American Shipper
- Class 8 Truck Orders Show Second Straight Gain in February – Transport Topics
- Descartes March Global Shipping Report sees mixed import readings – Logistics Management