
Executive Summary
The transportation industry and overall economy continued to exhibit mixed signals in September, similar to August.
In the truckload market, positive indicators included elevated demand, year-to-date highs in contract volumes, further contraction in capacity (primarily in the for-hire sector), and a mild return of seasonality. The fall harvest season supported volume growth in the intermodal sector, while import TEUs rose 0.3% over August and are 27% above this year's low point in February.
While the latest economic data does not suggest that a recession is imminent, it is not impossible. Real GDP estimates for Q3’23 range from 2.1% (unchanged from Q2’23) to 5.1%, according to the Atlanta Federal Reserve. Consumer spending remains strong and the labor market continues to expand, with the unemployment rate holding steady. Manufacturing activity, although still contracting, has shown improvement over the past four months, with the Manufacturing Purchasing Managers Index reaching its highest level of the year in September.
While the outlook has become slightly more optimistic than last month, the Federal Reserve's battle to tame inflation continues to walk a tightrope between achieving a soft landing and triggering a full-blown recession. The rise in energy costs over the past three months has boosted headline PCE and CPI, while the personal savings rate remains well below pre-pandemic levels. Consumer confidence declined slightly in September, and the resurgence of student loan payments after a three-year hiatus is likely to reduce discretionary spending in the coming months.
Main Takeaways
- Manufacturing activity in the U.S. remained in contraction territory for the eleventh consecutive month while the overall economy expanded weakly after nine straight months of contracting.
- The contract-to-spot rate spread widened further in September as average linehaul spot rate declines outpaced contract rate decreases.
- Demand in the contract market ended the month relatively flat from where it started, despite hitting a YTD high following Labor Day, while spot market activity deteriorated further.
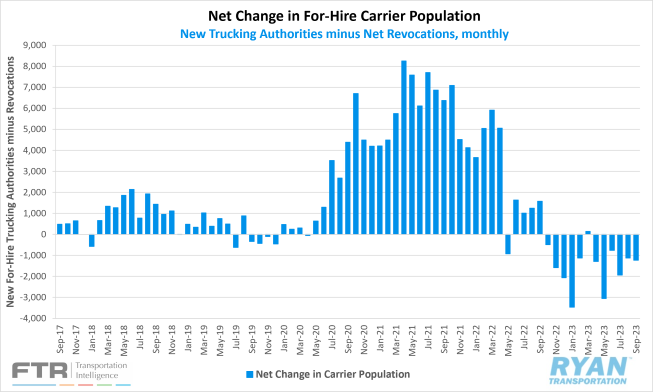
- Driven by fewer carriers entering the market, the net decline in the for-hire carrier population was slightly larger in September than August.
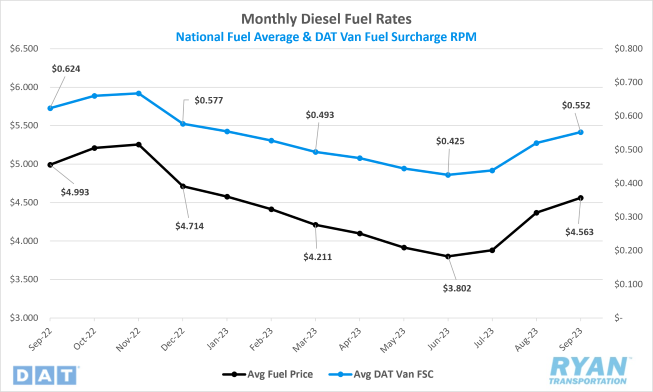
- The national average price of diesel increased for a third straight month in September as global supply levels remain strained.
Economy | Spot Rates | Truckload Demand | Truckload Supply | Fuel Prices | Dry Van Overview | Reefer Overview | Flatbed Overview
Economy
United States ISM Manufacturing PMI
Key Points
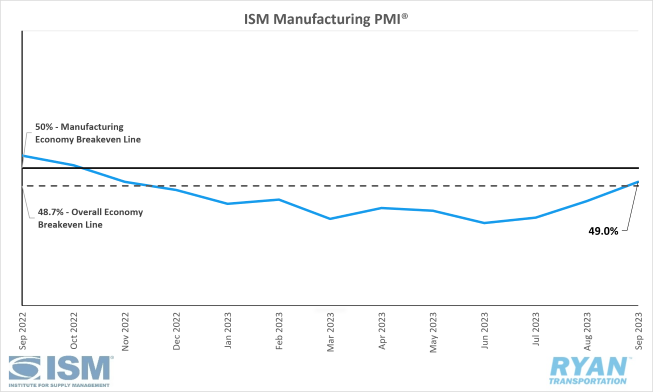
- The Institute for Supply Management (ISM) Manufacturing PMI® contracted in September for the eleventh consecutive month, registering 49.0%, a 1.4% increase from the August reading of 47.6%.
- The New Orders Index recorded a 2.4% increase to 49.2% in September over August’s figure of 46.8% and remains in contraction territory.
- Production expanded in September with the Index registering 52.5%, 2.5% above the August reading of 50.0%.
- The Employment Index returned to growth territory, recording a 2.7% increase from the 48.5% recorded in August to 51.2% in September.
Summary
Order softness continues to inhibit any real return to growth in the manufacturing sector, but the month-over-month improvement in the PMI® in September is a strong positive for the industry. Of the five subindexes that directly factor into the Manufacturing PMI®, two (Production and Employment) moved into expansion territory in September, which is up from zero in August. This breaks a three-month streak of no such growth.
The demand components of the composite index, reflected by the New Orders, Backlog of Orders and Customers' Inventories ndexes, continued to ease slightly in September but improved overall compared to August. The New Orders Index saw positive momentum last month, with a 2.4% increase over August. This has the subindex trending closer to breaking into expansion territory. The Backlog of Orders and Customers' Inventories both contracted further, indicating improved supply chain efficiency. Output improved, and customers' inventory levels moved into "too low" territory.
The Output and Consumption components, measured by the Production and Employment Indexes, remained positive in September. Both Indexes combined for a 5.2% upward impact on the Manufacturing PMI® calculation. This indicates that production levels are improving while companies continue to better manage head counts, primarily through attrition and hiring freezes to match current demand levels.
The Prices and Supplier Deliveries Indexes, which are a partial factor of the input components in the Manufacturing PMI®, both support future supply chain growth. Prices remain in "decreasing" territory, and supplier deliveries indicate that delivery times are speeding up for the 12th consecutive month.
Why It Matters
Although the manufacturing sector continued to contract in September, some optimism for a return to growth has been restored heading into the fourth quarter and the close of the fiscal year. The uptick in the New Orders Index is a positive sign for future production levels, which have already started to show signs of growth. The continued decrease in prices and customers' inventory levels entering "too low" territory are also positive indicators that could bring buyers back to the table ahead of 2024.
One potential drawback that could apply negative pressure on a return to growth in the industry is the rise in energy costs in August and September. This could affect future material costs, adding pressure to inflation concerns and further dampening demand. Of the six biggest manufacturing industries, only two (Food, Beverage & Tobacco Products and Petroleum & Coal Products) registered growth in September. Despite the potential drawbacks, after September’s results the outlook for future output has shifted toward optimism, with its highest level in over a year and a half.
Macro Impacts
- Total nonfarm payroll employment rose by 336,000 in September according to preliminary estimates from the Bureau of Labor Statistics (BLS).
- After months of downward revisions, the BLS revised the August total nonfarm payroll figure upward from 187,000 to 227,000 jobs added.
- According to the BLS report, the unemployment rate remained unchanged in September at 3.8%.
- The transportation and warehousing sector added 8,600 jobs, seasonally adjusted, in September after August was revised upwards, driven by an increase of 8,800 jobs in the truck transportation sector.
- According to the latest data released by the BLS, the Consumer Price Index registered a 0.4% increase MoM in September for headline inflation while core inflation rose 0.3%, on a seasonally adjusted basis.
- On an annual basis, the all-items index increased 3.7% and was unchanged from August’s figure while Core CPI increased 4.1% annually, down from 4.3% in August.
- The major energy component indexes were mixed in September, with the overall energy index increasing 1.5% MoM, seasonally adjusted, but decreasing over the 12 months ending in September by 0.5%.
- The Personal Consumption Expenditures (PCE) Index excluding food and energy, the Fed’s preferred inflation gauge, rose 3.9% YoY in August, falling below 4% for the first time in two years.
- Labor strikes against the Detroit Three (Ford, Stellantis and General Motors) by the United Auto Workers (UAW) union took effect on September 15 after contract negotiations failed ahead of their expiration.
- The initial UAW strikes began at one plant for each of the automakers and expanded from there as negotiations continued.
- According to a recent report by Anderson Economic Group, a Michigan-based economic consulting firm, the UAW strike is estimated to have resulted in $3.95 billion in economic losses through the first two weeks.
- In other recent news, UAW workers at Mack Trucks (owned by AB Volvo) rejected a five-year labor agreement that negotiators worked out with the company, resulting in a walkout at the Pennsylvania, Maryland and Florida facilities and bringing the total number of UAW members on strike to over 30,000.
Industry Overview
September Key Figures (YoY)
| Truck Data Points | YoY % Change |
|---|---|
| DAT Spot Rates (incl. FSC) | - 13.6 q |
| Fuel Prices | - 8.6 q |
| ACT Class 8 Preliminary Orders | - 31.5 q |
| ATA NSA Truck Tonnage* | - 2.4 q |
| Cass Freight Index* | - 11.5 q |
| Cass Freight Expenditures | - 25.0 q |
| Cass Freight Shipments | - 10.6 q |
* Report released 9/19/2023
Spot Rates
Key Points
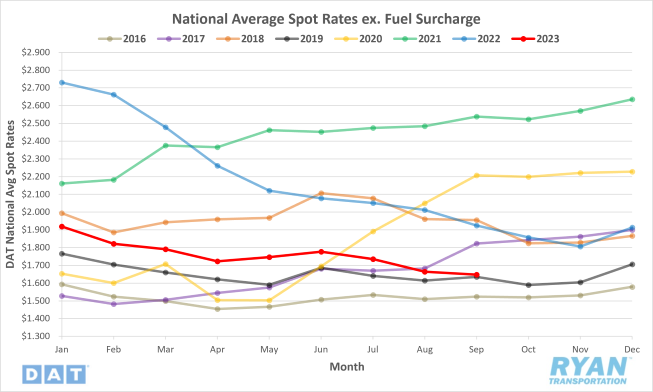
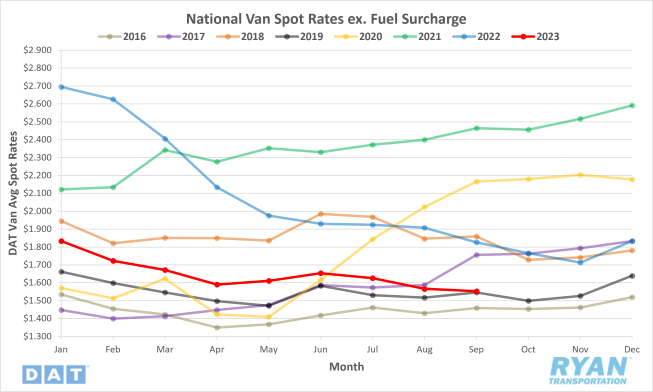
- The national average spot rate excl. fuel surcharge declined for the third straight month in September, falling 1.0%, or $0.028, from August.
- National average linehaul rates registered 14.4%, or $0.277, below September 2022 levels and are 19.7%, or $0.404, below the 5-year average.
Contract Rates
Key Points
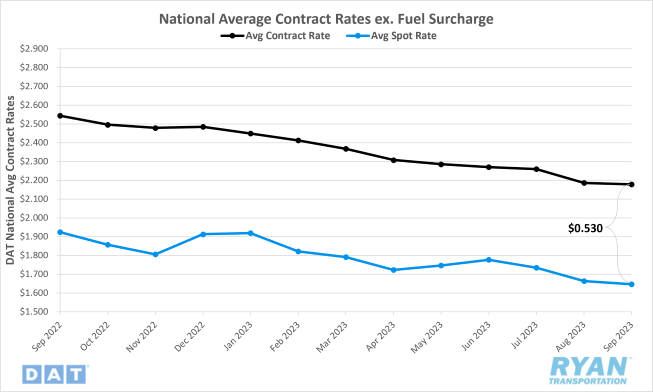
- The average contract rate excl. fuel saw little MoM change in September, dropping just under a penny per mile, or 0.4%, from August and sits 14.4%, or $0.366, below September 2022 levels.
- Average spot rate declines continued to outpace declines in the contract market in September, increasing the contract-to-spot spread by $0.007 to $0.530.
Summary
National average spot rates excluding fuel continued to decline in September, reaching a new low for 2023 and their lowest point since May 2020, during the pandemic. Linehaul spot rates experienced a brief uptick in the first few days of the month, ahead of Labor Day, in anticipation of the holiday capacity crunch. However, the oversupplied market quickly cut this momentum short, and rates returned to near end of August levels. By the third week of September, the linehaul spot rate 7-day average had fallen to $1.674, its lowest point since the pandemic and $0.44 below where it started the year, the most significant drop recorded so far this year. Negative pressure from the deteriorating spot market conditions continued to pull contract rates down, but at a much slower pace than in previous months. This has further widened the gap between contract and spot rates, increasing the spread to $0.530, its highest level since May of this year, and remains elevated against the pre-pandemic average.
Why It Matters
The performance of spot rates over the last few months is open to interpretation. On one hand, spot rates inclusive of fuel, which is the typical basis for negotiation in the industry, have not only risen but also outperformed typical seasonality since July. On the other hand, the rise in fuel surcharges over the last 11 weeks has likely put many small carriers in an untenable financial position, as linehauls have the most impact on their bottom lines.
Regardless of how one interprets the recent data, one thing is certain: there is uncertainty surrounding the future of spot rates. There are several opposing factors at play, with arguments for a rise and fall in rates.
On the downside, the oversaturation of carriers in the market is expected to continue to limit any real return to growth in the near term. This is compounded by rising energy costs, high interest rates (which are causing consumers to pull back on discretionary spending) and the recent UAW strike, which is likely to force many larger assets with strong ties to the automotive industry into the spot market to make up for lost revenue.
On the upside, capacity is exiting the market at historic rates as we enter Q4. This, combined with the seasonal bump in volumes and the capacity crunches associated with the holidays, should help to bring some normalcy back to carrier rates.
Based on our analysis, we anticipate the pricing environment to remain weak and near the bottom for the near term, reaching a balance as early as late Q1 of 2024 but more likely in Q2.
Truckload Demand
Key Points
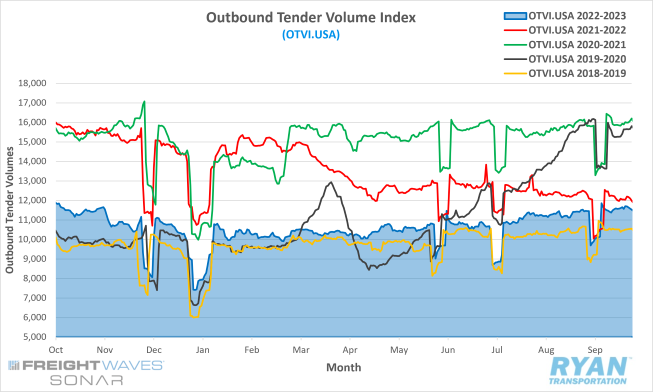
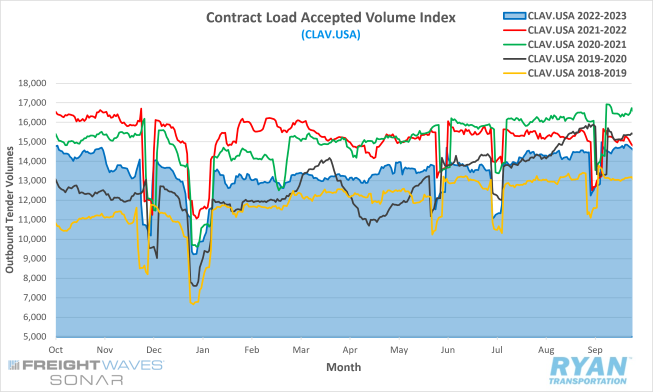
- The FreightWaves Outbound Tender Volume Index (OTVI), a measure of tender volumes across all modes, ended the month unchanged from where it started, registering 11,522.37, slightly higher than the 11,443.72 recorded by the Index a month prior.
- The monthly average of daily tender volumes recorded by the OTVI in September dropped 2.4% compared to August, falling from 11,291.57 to 11,016.81.
- September’s daily tender average was just over 6.0% below September 2022 levels and remains 11.8% below the 5-year average.
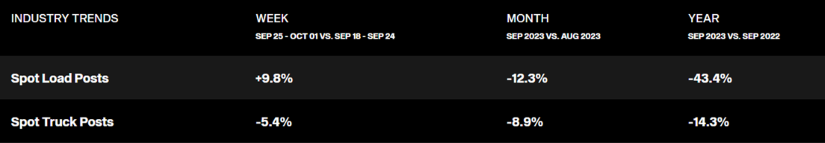
- Spot market activity dropped significantly in September, falling 12.3% MoM, and registering 43.4% below 2022 levels, per DAT.
- According to the most recent Cass Freight Index report, which analyzes the number of freight shipments in North America and the total dollar value spent on those shipments, both shipments and expenditures continued to trend negatively in August on an annual basis by -10.6% and -25.0% respectively but increased 1.9% and 1.1% respectively monthly.
Summary
Demand levels were more volatile in September than in previous months, despite ending the month slightly above where they began. Volumes opened the month with some positive momentum, due to shippers getting last-minute orders out ahead of the Labor Day weekend and the predictable lull in demand in the week following the holiday. Rather than recovering to their pre-holiday levels, contract volumes surged over 22% to set a new year-to-date high on the Monday after the holiday. This was the highest OTVI reading since October 2 of last year. Demand remained strong through the next few weeks before waning off in the final few days of the month.
While contract market demand showed positive signs of a return to seasonal trends, the spot market continued to struggle in September. Signals of a market recovery in 2023 are weakening as the year progresses. Spot market activity saw an initial drop during the week of Labor Day, falling 11.7% for the largest week-over-week decline since the week of the Fourth of July. However, like the trend observed on the contract side, spot volumes rallied during the second full week of the month, surging 18% and bringing levels just over 15% below the same week in 2022, according to FTR's analysis.
Why It Matters
The September freight market exhibited some similarities to the market in 2019, which was the last year of a significant industry recession. One similarity was the slow but steady volume growth observed throughout August, interrupted by an expected lull in activity due to Labor Day. Another similarity was the surge in volumes to a year-to-date high, which occurred in the same week for both years. However, oddly enough, the only other year that volumes surged to a year-to-date high during that week was 2021, which was arguably the greatest year for freight demand.
Volume levels would eventually stumble back down to levels seen in 2019, closing out the month 1.1% below where they started with a 0.6% gain this year. The correlation is not absolute, but the consistency of the pattern through September carries some significance, as it was at this point in 2019 that marked the initial stages of the market recovery.
Some experts speculate the muted impact from the traditional maritime peak season and the increase in long-haul demand originating from the West Coast, typically associated with inventory restocking, provide further support for the theory that the market is beginning to rebalance. Another theory suggests that volumes were artificially inflated in September because of the impending UAW strikes, with many in the automotive industry front-loading orders ahead of the potential shutdowns.
Truckload Supply
Key Points
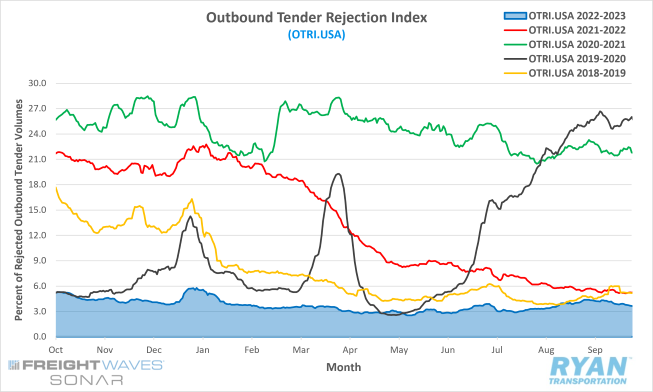
- The FreightWaves SONAR Outbound Tender Rejection Index (OTRI), a measure of relative capacity in the market based on carriers’ willingness to accept freight volumes under contract reflected as a percentage, registered 3.65% at the end of September, 74 basis points below where it started.
- The rejection index dipped below 4.0% at the start of the third week of the month for the first time in over three weeks.
- Despite the sequential declines throughout most of the month, the average daily rejection rate of 4.36% in September still registered 62 basis points above the August reading of 3.74%.
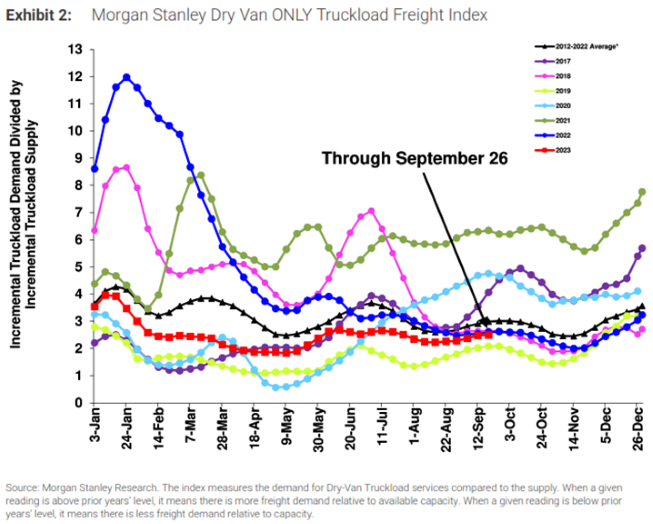
- The Morgan Stanley Truckload Freight Index (MSTLFI) increased sequentially in its last three updates but underperformed seasonality at the end of September after trending inline in the first half of the month.
Summary
Truckload supply continued to gradually contract in September, but it remains significantly elevated relative to the weak demand environment. Tender rejections stalled during the week of Labor Day after consistent week-over-week increases in August. The OTRI, which measures the percentage of loads rejected by carriers, reached its highest level of 4.39% since January on the last day of August. Pre-holiday activity kept rejection rates elevated around their eight-month high, as the OTRI was up 40 basis points week-over-week to start the month but 0.43% below the same time in 2019.
Despite the unprecedented surge in demand during the second full week of September, rejection rates remained unimpacted, with the index dropping slightly over the week. Most of the declines recorded by the rejection index occurred in the back half of the month, with the OTRI falling 66 basis points in the final two weeks, coinciding with the drop in demand levels from their year-to-date peak earlier in the month.
According to ACT Research's For-Hire Trucking Index, which measures the degree and directional changes in operational statistics in diffusion indexes based on a survey of carriers, the Fleet Capacity Index fell by 1.0 point month-over-month in August, signaling that fleets are slowly starting to rein in supply after significant industry growth in the past few years.
Why It Matters
While rebalancing efforts are underway in the current cycle, the timeline for any significant improvement remains uncertain, as the oversupply of carriers continues to keep the market at its bottom. The tender rejection index provided some support for capacity contraction in the for-hire trucking sector in the preliminary stages of the cycle, but inflated readings from holiday impacts make the outlook less clear.
The elevated rejection rates ahead of Labor Day were predictable, as routing guides are disrupted when drivers take time off to enjoy the long weekend. This was indicated by the OTRI surpassing 4% for the first time since January in the week leading up to the holiday. Rather than correcting itself back to pre-holiday levels, the OTRI remained elevated above the 4% mark over the next three weeks. This is a weak sign, but a sign nonetheless, that supply levels are gradually eroding.
However, as mentioned in our previous update, rejection rates need to be in the range of 5% to 7% for major carriers to notice any disruption taking place across their networks. This means that there is still a way to go before supply constraints provide consistent upward pressure on truckload rates.
Truckload Capacity Outlook
Key Points
- Total net revocations, which are total authority revocations minus the number of reinstatements, registered 6,398 carriers in September, a 0.2% decline, or just 11 fewer carriers than August’s figure of 6,409 authority revocations, according to FTR Intel’s preliminary analysis of the Federal Motor Carrier Safety Administration’s (FMCSA) data.
- Per FTR’s report, the number of newly authorized for-hire trucking firms in September was 5,163, just 117, or 2.2%, less than August’s total of 5,280.
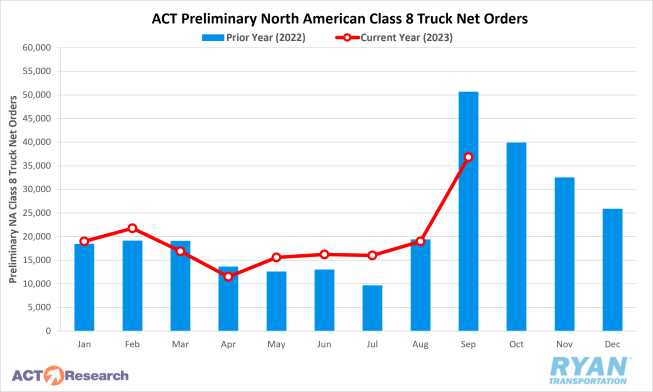
- Depending on the estimate, preliminary North American Class 8 orders ranged from 31,200 and 36,800 in September, registering 27% and 45% below the record high set in September 2022.
Summary
The net change in the carrier population declined by 1,235 carriers in September, slightly higher than the decline in August of 1,129 carriers. September's change was primarily driven by a decrease in newly authorized operating authorities to their second lowest level since July 2020, with the only other lower reading coming in July of this year, when only 5,092 authorities were activated.
Revocations continue their historic pace but have slowed over the last two months, with September's figure of 6,398 carriers registering the lowest point since July of last year. On a quarterly basis, net revocations in the third quarter were just shy of 20,000 carriers and nearly 3,000 less than the total revocations in the second quarter for the lowest quarterly total in nearly a year.
Equipment orders remained strong in September, with fleets placing the highest number of Class 8 bookings so far this year, as preliminary orders registered a 67% month-over-month increase from August, per ACT Research's 36,800-unit estimate. According to FTR, the September figure is consistent with the beginning of the fall order season and is a positive indicator for the industry in 2024 but was not expected to match the level of orders registered in September of last year, when bookings hit an all-time high of 53,700 units.
Though the growth in future tractor orders supports an optimistic outlook, active utilization among current fleets remains well below the 10-year average of 92%, according to an FTR report. Active utilization likely bottomed out in the second quarter, around 88.1%, and has been gradually climbing since then. Per FTR's analysis, though, utilization is not expected to exceed the 10-year average until early 2025.
Why It Matters
The for-hire carrier population has declined in 11 of the last 12 months, but capacity levels remain elevated despite the depressed truckload market. New entrants into the industry have cooled off as the year has progressed. But on a quarterly basis, the number of newly authorized operating authorities in the third quarter was roughly 5,000 carriers above the levels immediately prior to the pandemic. Digital freight platforms have played a key role in the resilience of new entrants so far this year, but regulations unfavorable to the leased owner-operator model have also been a factor.
Total net revocations in the third quarter fell short of those recorded in the second quarter, which was unexpected given the further deterioration of industry conditions. However, it is important to note that the data used to track the change in the carrier population generally lags by two or more months due to the steps and procedures involved in revoking an operating authority. Therefore, it is likely that the data does not yet reflect the potential effects of the surges in diesel prices that occurred starting in July.
While the for-hire sector continues to shed capacity, the rise in Class 8 orders presents a different outlook and casts further uncertainty toward a return to better market conditions. The increase in preliminary estimates in Class 8 bookings in the last two months indicates that capacity is still being added to the industry, primarily by private and large fleets. A September increase was expected, as OEMs have finally worked down backlogs due to slow orders during the summer months and traditionally open all their build slots for the next year around this time.
ACT Research speculates that some of these orders could be a hedge against tougher environmental standards that take effect in 2025 for heavy-duty trucks in California. By ordering trucks now and having them built before the standards go into effect, the models will be grandfathered into a fleet's allowable percentage of diesel trucks. Another theory behind the increase in orders is that manufacturers allow order cancellations up until they purchase the materials to build the trucks, so it is a flexible hedge for larger fleets in case the market recovers between now and then. Ultimately, an improvement of conditions could be spoiled if fleets continue to expand ahead of industry needs.
Fuel Prices
Key Points
- The national average price of fuel increased for the third straight month in September, registering 4.4%, or $0.192, higher than August’s average.
- At $4.563, the average price of diesel sits 8.6%, or $0.430, below 2022 levels and is 20.7%, or $1.191, below the historic highs recorded last June.
- Draws on U.S. commercial crude inventories continued to outpace builds in September, as the net change in commercial crude stocks declined by 2.6M barrels (bbls) versus the consensus of -4.9M bbls for the weeks ending September 8 and September 29, according to the Energy Information Administration (EIA).
- For the week ending September 29, total crude stocks, which includes both commercial stocks and the strategic petroleum reserves, registered their lowest level since April 1985 of just over 765M bbls, according to data sourced from the EIA.
Summary
Fuel prices climbed further last month as the national average price of diesel increased to $4.563, a 4.4% increase over the average in August, making September the third consecutive month of MoM gains since June. After 10 weeks of sequential increases, fuel prices fell $0.047 WoW in the final week of September. Crude prices of West Texas Intermediate (WTI) exceeded $90 per bbl halfway through the month for the first time since August 30 of last year as fears mounted surrounding the lack of global supply levels heading into the winter months.
Domestic drilling activity continues to decline as the active drill rig count has fallen to 502 for the week ending September 29, sitting nearly 17% below the same time last year and 19% below where they started the year, according to the most recent Baker Hughes report. Concerns deepened following an announcement by OPEC+ that production cuts started earlier in the year would be extended through the end of the year. According to the most recent Short-Term Energy Outlook produced by the EIA, despite the extension of OPEC+ production cuts, global supply levels are projected to increase by 2.0M bbl per day through 2023, driven by non-OPEC production led by the United States, Brazil, Canada and Guyana.
Why It Matters
The global oil market faces several headwinds driving up prices and creating uncertainty around the future. The primary challenge comes from the overall decline in supply levels. OPEC+ has extended its production cuts and Saudi Arabia has announced further output reduction through the end of the year. Further complicating the supply picture is Russia’s recent announcement of export bans on gasoline and diesel to all but four ex-Soviet nations, raising concerns of a potential energy crisis in Europe.
U.S. stockpiles are near 40-year lows, with no expected relief from domestic drilling in the near-term, as producers cite a need for financial discipline during what they call the current administration’s ‘war’ on fossil fuels. According to the latest data out of Cushing, Oklahoma, the nation’s major oil storage hub, the 98M barrel storage tank now stands at 23M barrels, a level that is close to the operational minimum of 20M barrels. This limits any future ability for the U.S. to keep supply levels elevated and prices suppressed.
Despite many analysts pointing toward refinery maintenance season, which generally occurs in October, having the potential to build up stockpiles, other analysts argue many refiners will likely exit maintenance early if demand remains elevated. While these factors provide a negative outlook for future prices, some analysts expect volatility and price spikes to be short-lived, with crude prices settling near $90 per barrel for the remainder of the year.
The continued soaring prices could shift consumer behavior and weaken demand at the pump. The other catalyst for market stabilization is the peak travel months now being in the past. Demand through the rest of the year will be centralized around industries focused on economic growth. However, the global oil market remains unstable, leaving it susceptible to significant swings in the event of a major macroeconomic disruption.
Dry Van Overview
Spot Rates
Key Points
- Average dry van spot rates excl. fuel declined in September for the fourth consecutive month, dropping 0.8%, or $0.013, from August to $1.553.
- Dry van linehaul rates sit 15.0%, or $0.273 below the same time last year and are 21.3% below the 5-year average.
- Dry van contract rates excl. fuel fell slightly in September, having now registered MoM declines in 18 of the last 19 months, dropping 0.1% from the average in August and sitting 15.9% below 2022 levels.
Load-to-Truck Ratio
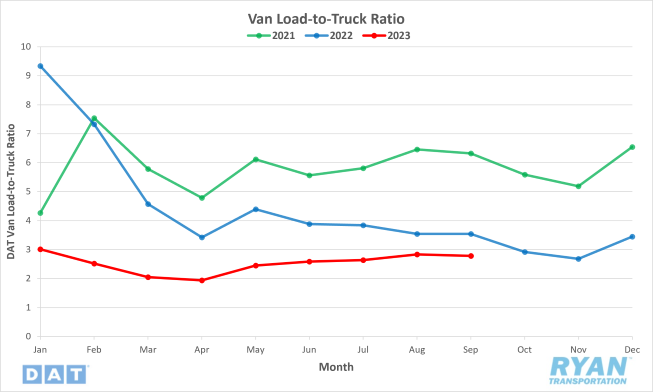
Key Points
- The dry van load-to-truck ratio (LTR) decreased 1.8% in September from August, moving the ratio to 21.5% below September 2022.
Market Conditions
Summary
Dry van volume saw a slight decline in September because of weak demand in several wholesale trade sectors such as miscellaneous durable goods and farm products. The YoY decline is more broad-based and is driven by lower production, including the manufacturing of paper, wood, plastic and rubber products. While the dry van LTR saw a significant jump in the first two weeks of September, rising from 3.02 to 3.31, volumes dropped off dramatically in the following two weeks before rebounding to finish the month at 3.07, only the fifth time the LTR has been over 3.0 this year. The 7-day average linehaul rate for vans remained consistent for the first half of the month but dropped $0.05 in the next two weeks and closed out the month with a $0.03 increase, as volume increased 8.4% after a 4.8% decrease the previous week. According to a panel from FreightWaves, there will be a tapering of the online retail hype that occurred over the last three to four years. They believe this will pull us back to normalcy with more significant freight moves in the supply chain.
It was also noted that the soonest we will come out of this freight volume recession is the second quarter of 2024, as a best-case scenario. This also echoed what professor Jason Miller of Michigan State University stated with the release of the latest Trucking Ton-Mile Index (TTMI). For many truckload carriers, the TTMI has been the most reliable indicator of freight demand, which points toward a prolonged period of weak truck transportation demand. Experts are predicting Q2 of 2024 as the earliest reprieve, yet some are warning of a worst-case scenario that looks into 2025 after looking at historical data from the 1980s and 1990s where there were periods of 2- to 3-year freight recessions.
Reefer Overview
Spot Rates
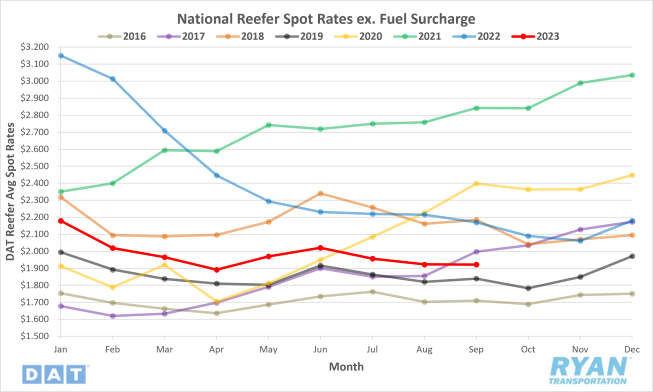
Key Points
- The national average spot rate excl. fuel for reefers changed little on a monthly basis, declining only 0.1%, or $0.001, from August to $1.922.
- Refrigerated linehaul rates in September were down 11.4%, or $0.248, from the same month in 2022 and sit 16.0% below the 5-year average.
- Contract rates excl. fuel for reefer carriers trended positively for the third straight month, with rates gaining 1.0%, or $0.030, over August’s average but remaining 10.9% below the same time last year.
Load-to-Truck Ratio
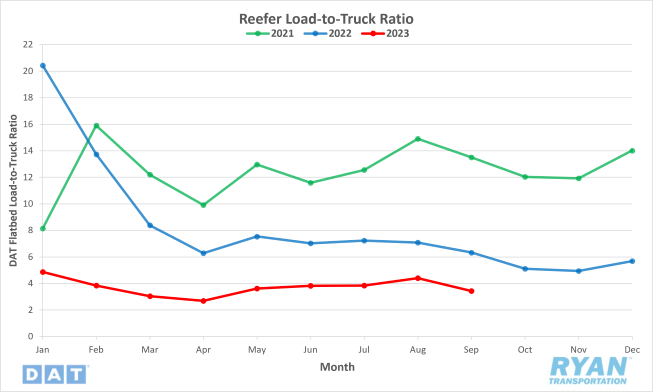
Key Points
- The reefer LTR fell significantly in September after four months of gains, dropping 22.2% from August and putting it 45.8% below September 2022.
Market Conditions
Reefer Summary
Refrigerated freight had a rough month in September. WoW declines in the 7-day average linehaul were commonplace in the first three weeks, with rates decreasing $0.05 before a slight increase of $0.01 to close out the month. California, the largest market for refrigerated trucks, was not doing well before Hurricane Hilary hit, but now growers expect to lose around one-third of this season’s grape harvest. According to the USDA, this comes at peak harvest time when volumes are already 5% lower than last year. With approximately 30% of the crop harvested when the hurricane hit, about 35%, or 25 million boxes, have been lost. To compound matters, Hurricane Idalia made landfall with winds close to a Category 4 storm on the East Coast. According to the Georgia Department of Agriculture, damage to pecan and sweet corn crops were reported. Pecan crops were hardest hit with several large growers reporting 10,000 to 15,000 trees down, with an estimate of at least 50% crop loss in the form of nuts blown from trees. The weak California volumes are the lowest since 2016 and spot market volumes are roughly half of what they were a year ago, resulting in the LTR increasing slightly from 4.28 to 4.40, the lowest LTR in seven years.
In related news, apple production numbers in the PNW are expected to be up about 20% YoY according to local growers, but in New York and Vermont, the late May frost caused 20%, and potentially up to a 90%, loss in apple crops. The USDA has warned it will be another six weeks before fall produce season starts to impact reefer spot market volumes, which typically occurs at the end of October each year. They are also reporting an adequate supply of trucks in San Joaquin and Coachella valleys, where almost 100% of grape production came from last year. Capacity could loosen in the region, forcing spot rates down even further.
Flatbed Overview
Spot Rates
Key Points
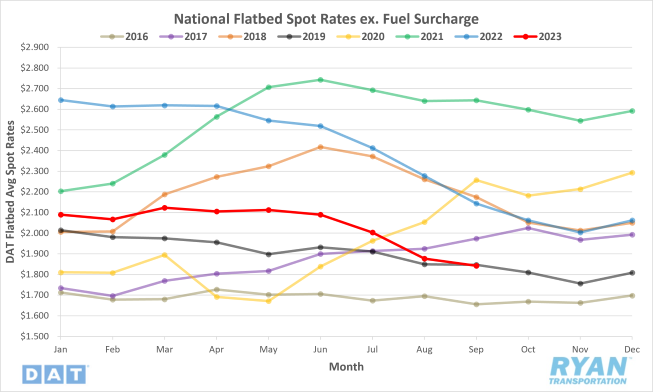
- Flatbed spot rates excl. fuel continued their downward spiral in September, falling 1.8%, or $0.035, from August to $1.842, their lowest level since June 2020.
- Flatbed linehaul spot rates now sit 14.0%, or $0.395, below September 2022* and are 16.9% below the 5-year average.
- Contract rates excl. fuel for flatbed carriers declined further as well in September, dropping 0.7%, or $0.019, from August to $2.542 and sit 10.8% below September of last year’s levels.
*As the year progresses, previous year comparisons are becoming more favorable. This is reflected in the YoY change to linehaul rates in September of -14.0%, which was an improvement from the YoY comparisons over the last 12 months that average -19.2%.
Load-to-Truck Ratio
Key Points
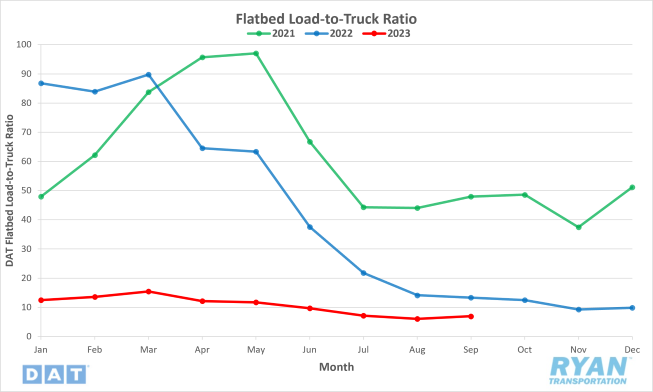
- The flatbed LTR improved substantially after five months of decline, increasing 14.7% from the previous month but remaining down 47.9% compared to the same period in 2022.
Market Conditions
Flatbed Summary
Flatbed trucking saw a slight increase in rates and volume in September. Flatbed volumes improved on a WoW basis all month and ended 14.7% up from August. After six weeks of gains, flatbed LTR ended up at 8.08 to end the month, the first time the flatbed LTR has been over 8.0 since the end of June. Despite the strong gains in volume, it did not positively affect pricing, as linehaul pricing remained relatively flat over the month. The 7-day average for flatbed linehaul rates fell $0.02 through the first two weeks of the month to hover at that early pandemic level before a $0.01 increase to finish out the month.
As of the end of FY 2023 (September 30), states have committed $3.2 billion, or 30% of available bridge formula funds, to 2,060 different projects, with $7.4 billion still to come. This translates to a lot of flatbed freight still to be hauled. These structurally deficient bridges adversely impact all carriers but none more so than flatbed carriers – load securement will be critical.
Steel output the week ending September 2 was up 1.2% compared to the same time in 2022, according to the American Iron and Steel Institute (AISI). Year-to-date production was 59,844,000 net tons (NT), which is down 1.8% from the 60,948,000 NT during the same period last year. In flatbed truck loads, this is approximately 36,800 fewer loads this year. Linehaul rates from Houston to Lubbock are at their lowest level in 12 months, at $2.12/mile. According to Baker Hughes, the oil and gas drilling rig count is 18% lower than last year (their lowest level since February 2022), resulting in fewer loads of drill pipe, casings and machinery.
There are also a tremendous number of homebuyers waiting in the wings for interest rates to come down, and if they do, that would be a significant catalyst for the flatbed freight market. Newly built single-family homes comprised a record share of homes on the market in the second quarter of the year, making up nearly one-third of house inventory nationwide, according to research from Redfin. New home sales typically make up 10% of the market. According to the latest release from the U.S. Census Bureau, new home starts in August dropped 4.3% MoM, but permits to build were just over 5% higher than August last year. The Southeast region accounted for 63% of single-family homes started last month.
Intermodal
Spot Rates
Key Points
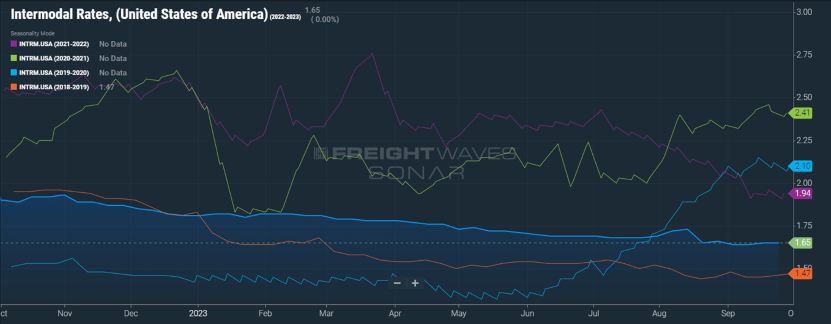
- The FreightWaves SONAR Intermodal Rates Index (INTRM.USA), which measures the average weekly all-in door-to-door intermodal spot rate for 53’ dry vans across a majority of origin-destination pairings, remained flat in September at $1.66, despite dropping $0.02 after the first week of the month.
- According to the index, intermodal rates were down 12.6% compared to the same time in 2022 and registered 13% below the 5-year average.
Volumes
Key Points
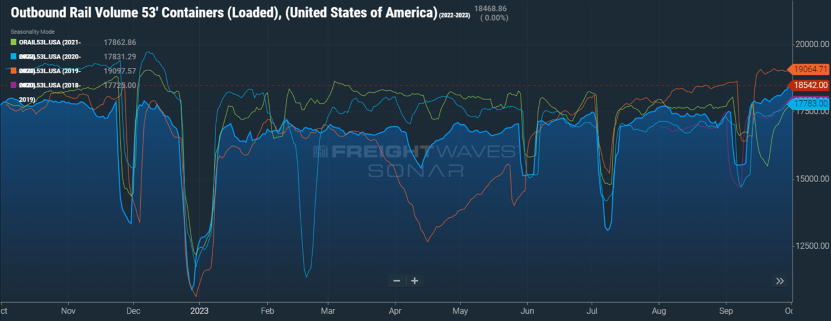
- Total loaded volumes for 53’ containers from all domestic markets, measured by the FreightWaves SONAR Loaded Outbound Rail Volume Index (ORAIL53.USA), increased 6.2% in September and registered 4.5% above the same time last year.
- Compared to the 5-year average, carload volumes last month were 1.7% higher.
Intermodal Summary
Intermodal volumes showed resiliency in September despite no significant improvement in any of the challenges that have kept traffic at bay throughout most of the year. Traffic saw consecutive increases in the weeks following Labor Day, with volumes reaching their highest level of the year thus far in the third week of the month. The increase in overall carload volumes was driven by agricultural volumes and economically sensitive freight throughout the month as harvest season begins to ramp up. The fall harvest season is expected to support volumes as it traditionally does over the next six to eight weeks.
Despite double digit increases in freight volume since the start of the year, the competitive conditions against the deteriorating truckload market continues to keep rates suppressed. According to the FreightWaves SONAR Intermodal Contract Savings Index (IMCSI1.USA), which measures the percentage difference between initial reporting of intermodal contract rates and dry van contract rates in the same lane, the spread between intermodal and van rates rose 71 bps over the course of the month, ending September at 9.85% in favor of the former. Although it’s a move in the right direction, contract savings via the rail are still roughly 5% below the 5-year average of 14.9%, making the over-the-road option still more appealing to most customers.
Much like the truckload market and overall economy, the outlook for the intermodal sector remains unclear based on the previous month’s data. Regulatory measures established by the Surface Transportation Board (STB) continue to drive improvements in overall service levels across the intermodal industry. However, much of these gains can be attributed to lower volumes helping to clear up congestion that improved equipment cycle times and productivity. With many executives still predicting a muted, or even a potential lack of, peak season this year, the progress made thus far seems unsustainable following harvest season.
Further Reading
- Heavy Duty Trucking (HDT): Class 8 Orders Nearly Double as 2024 Build Slots Fully Open
- FreightWaves: Some positive signs but trucking market moves ‘deeper into limbo’
- Logistics Management: September U.S.-bound imports buck seasonal trend, with a slight gain over August, reports Descartes
- DC Velocity: Peak season for intermodal arrives with a whimper, as slack demand depresses volumes